Yes they are:
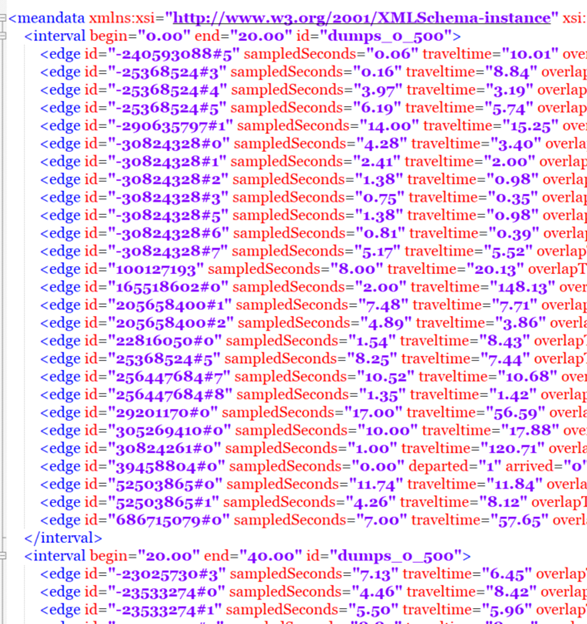
<interval begin="0.00" end="20.00" id="dumps_0_10000">
<edge id="-240593088#5" sampledSeconds="0.06" traveltime="10.01" overlapTraveltime="10.94" density="0.06" laneDensity="0.02" occupancy="0.00" waitingTime="0.00" timeLoss="0.04" speed="5.39" departed="0" arrived="0" entered="1" left="0" laneChangedFrom="1" laneChangedTo="1"/>
<edge id="-25368524#3" sampledSeconds="0.16" traveltime="8.84" overlapTraveltime="9.62" density="0.14" laneDensity="0.07" occupancy="0.00" waitingTime="0.00" timeLoss="0.07" speed="6.43" departed="0" arrived="0" entered="1" left="0" laneChangedFrom="0" laneChangedTo="0"/>
<edge id="-25368524#4" sampledSeconds="3.97" traveltime="3.19" overlapTraveltime="3.97" density="7.53" laneDensity="3.77" occupancy="1.59" waitingTime="0.00" timeLoss="1.31" speed="7.90" departed="0" arrived="0" entered="1" left="1" laneChangedFrom="1" laneChangedTo="1"/>
I have tried also with sampledSeconds,traveltime and still did not work:
I used this command:
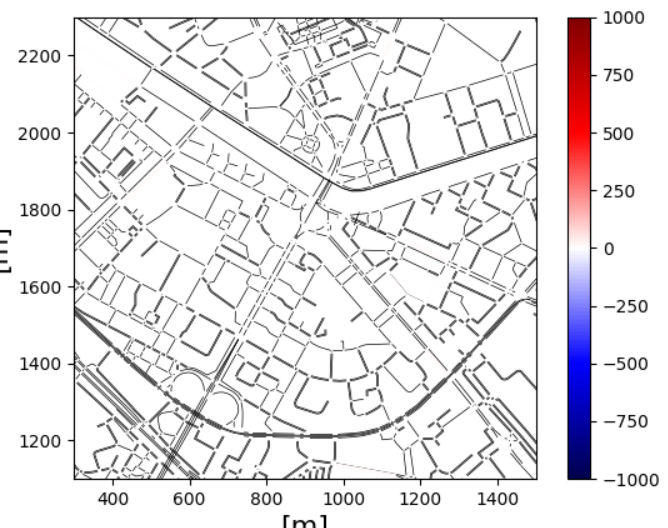
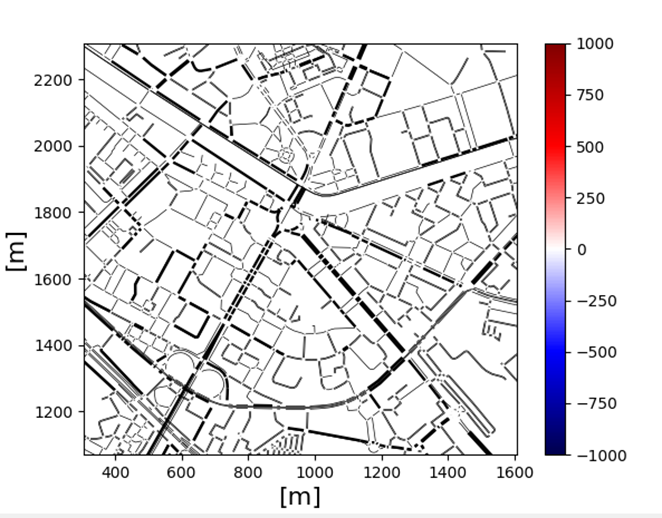
python SUMO_HOME/tools/visualization/plot_net_dump.py -v -n pr.net.xml --measures sampledSeconds,traveltime --xlabel [m] --ylabel [m] --default-width 0.5 -i dumps_0_10000.xml,dumps_0_10000.xml --xlim 300,1500 --ylim 1100,2300 --min-color-value -1000 --max-color-value 1000 --min-width-value -1000 --max-width-value 1000 --colormap seismic
Any more ideas :( ?