[Date Prev][Date Next][Thread Prev][Thread Next][Date Index][Thread Index] [List Home]
Re: [sumo-dev] plot_net_dump visualization
  • From: <Daniel.Krajzewicz@xxxxxx>
  • Date: Fri, 3 Sep 2021 06:40:17 +0000
  • Accept-language: de-DE, en-US
  • Delivered-to: sumo-dev@xxxxxxxxxxx
  • Ironport-hdrordr: A9a23:0IuCzqDTFYKD5K3lHemC55DYdb4zR+YMi2TDj3oBLSC9Afbo8P xG/c5rryMc5wxwZJhNo7290ey7MBbhHP1OkPQs1NWZLWrbUQKTRekIh7cKgQeQeREWndQz6U 4USclD4arLY2SS4/yX3ODyKadH/DDOytHQuQ7x9QYUceklAZsQlDtENg==
  • Ironport-phdr: A9a23:aAP82hRTgMAFy4cEgpmrDtMFhdpsormYAWYlg6HPa5pwe6iut67vI FbYra00ygOTBcOCsawP0rKL+4nbGkU4qa6bt34DdJEeHzQksu4x2zIaPcieFEfgJ+TrZSFpV O5LVVti4m3peRMNQJW2aFLduGC94iAPERvjKwV1Ov71GonPhMiryuy+4ZLebxtUiDanfL9+M hS7oQrMusUKgYZpN7o8xAbOrnZUYepd2HlmJUiUnxby58ew+IBs/iFNsP8/9MBOTLv3cb0gQ bNXEDopPWY15Nb2tRbYVguA+mEcUmQNnRVWBQXO8Qz3UY3wsiv+sep9xTWaMMjrRr06RTiu8 6FmQwLuhSwaNTA27XvXh9RwgqxFvRyhuxJxzY3aYI6XNfpxYqzScMgARWZdXMZcTTBNDp++Y oYJEuEPPfxYr474p1YWqhawCxOjBOXuyjBWgn/6x6g00/47HgHE3Q0vAdwPsHXIo9T0L6odT OS1zLPSwTrecfxbwDHw45XHfR49u/+DR65wcdbPxkk1EQPIlkmcpI7lMj2VyugDvXSW4vdkW Oyhj2MqtgN8riSry8sxjoTHhowbx1HE+Chlwos4KsG1RUF7bNCkEJVdtS6UO5ZwT8g/TW9ov yM6xacHuZ69ZCUF1ogoxxrea/yfaIiH/AjvVOGLITd3nH5ldqiwiAqs/ke7ze38Ucq03ExWo SpCl9nArnQN1x3V6siEVPRy40ah2TCV2w/P7eFEJEY5nrfYJZ452rM8i4YfvV7eEiL1l0j6l rKae0sn9+Sy9ejrf63qqoKAO4Nulw3zMasjltaiDek2MQUCRXaX9OSz2bDl4Eb3Wq9Fjucsn ancqJ3aIMMbqbOnDAJNyYYj7gq/Dy+h0NQFgXkLNFJFdwyDj4juI1zALvb2A/mwjVqskDllw PPIMLr7DJnTM3TNn7bucKhn505dzgoz0cpf6IhOBr4cJPLzQFX9u8HGARMhMgy0xfjoCMll2 48DRW6DGLKVPaDdvFOS++4iLeqBaJULtDrgM/Ql4uThjX49mV8TZ6mp2p4XZWi2EPt8JUWZY GTjgtMbHWkPpAoxVu7qiVycXj9dZna9Q6M96yomB4KiF4fPXJ2ij6KZ0CehApJWfnxGCkyLE XrwbIWERvIMaCWLLsB8jDMES6OsRJE92hGqtQ/606FnIfTO9i0fr5Lj24s92uvIiBtn9SBoF 9/PlCaSUH4yk2gMRict0eZ4u0M6z16C1a1xhbtcFMdP5vVHVUAhKJvbiuB3FYPPXBncdPeVT VLzQsm6GSpjCZUu3MBIbk15Gs25g1bExSXtBrYUk7mCAtsw87nA3n7/IIFm1nPBkaUskQobR NBSP1GrlrIq9xTPH5Wb1AKGiLnseK8Y3TbW+SGE12XJuUhZVAt5V+LBXGsDZ03YqpPi+0bFC rOjF+cbNV4V0tOHLe5GZ8PBgF5CRe/4NZLZeW3nyEmqAhPdkp+FaovnfyM+xizfGkUbkgsB1 XqCL04yC3Hy8CrlEDVyGAe3MAvX+u5kpSbjJnI=
  • Ironport-sdr: /oOVaVpXkVQLfxyugBtxMXqI90lU8Gnhyra8uaEoIQVojWFNK8MR4Tx3MhQq0epGzs5M4YdljN YN5L4/CH6W2Q==
  • List-archive: <https://www.eclipse.org/mailman/private/sumo-dev/>
  • List-help: <mailto:sumo-dev-request@eclipse.org?subject=help>
  • List-subscribe: <https://www.eclipse.org/mailman/listinfo/sumo-dev>, <mailto:sumo-dev-request@eclipse.org?subject=subscribe>
  • List-unsubscribe: <https://www.eclipse.org/mailman/options/sumo-dev>, <mailto:sumo-dev-request@eclipse.org?subject=unsubscribe>
  • Thread-index: AQHXoCLfFW46laUNFk+r78XolAt9WauRrOYAgAADlACAAAmIgIAAImFQ
  • Thread-topic: [sumo-dev] plot_net_dump visualization

Hello there,


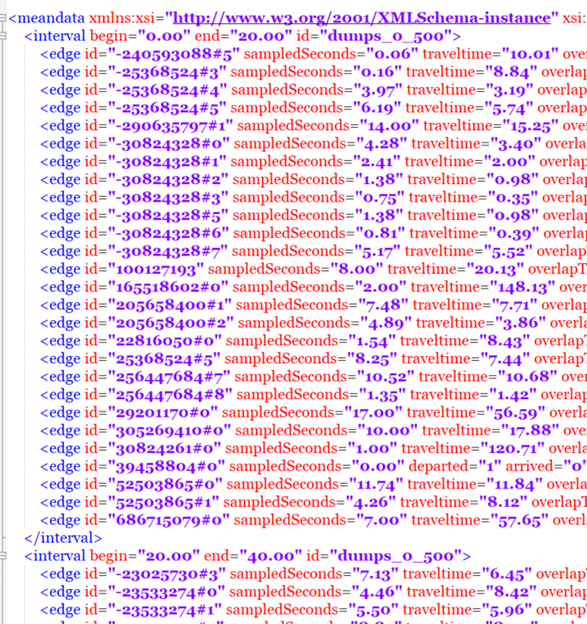
You pass “--measures speed,entered” as measures to show, but they are not included in your files. Use “--measures sampledSeconds,traveltime” instead.


Sincerely,

Daniel


Von: sumo-dev <sumo-dev-bounces@xxxxxxxxxxx> Im Auftrag von Jakob Erdmann
Gesendet: Freitag, 3. September 2021 08:36
An: sumo developer discussions <sumo-dev@xxxxxxxxxxx>
Betreff: Re: [sumo-dev] plot_net_dump visualization


Both files passed to the plotting script must cover the same time intervals. The first file is used for the colors and the second for the width (the same file may be used for both parts).

By passing two files with different time ranges to the script, no color and width data with the same timestamps are found.


Am Fr., 3. Sept. 2021 um 08:01 Uhr schrieb Iulia Onică <onica.iulia26@xxxxxxxxx>:

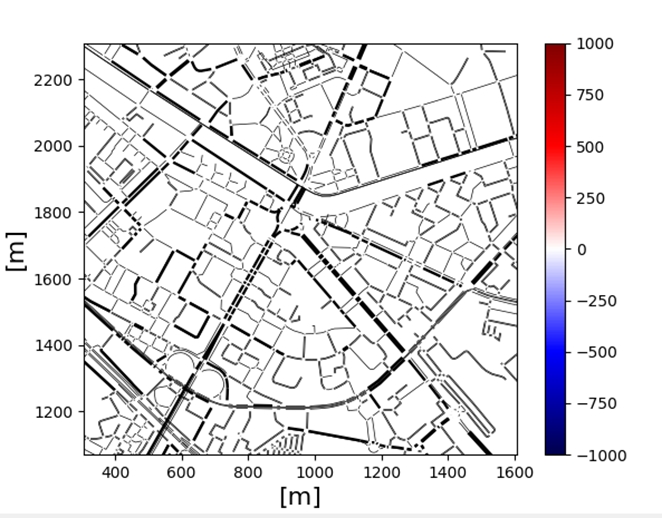
It is not like there is no plot at all. By removing the limits it gets zoomed out.

It is plotted like this:

image.png

The problem is that it is not colored at all.

Also, the path I am using looks looks this:

python D:/prog/tools/visualization/plot_net_dump.py


Do you have any idea what might be?


Thank you!


On Fri, Sep 3, 2021 at 8:49 AM Jakob Erdmann <namdre.sumo@xxxxxxxxx> wrote:

Possibly, you are plotting an empty spatial range. Try running your command without --xlim and --ylim.  Also, the tool is located at SUMO_HOME/tools/visualization. If you put it someplace else it may not find it's libraries.


Am Do., 2. Sept. 2021 um 19:49 Uhr schrieb Iulia Onică <onica.iulia26@xxxxxxxxx>:

Hello,


I was trying to get a plot using plot_net_dump python script but it seems like nothing is plotted.

I used the following command:

python .SUMO HOME/plot_net_dump.py -v -n pr.net.xml --measures speed,entered --xlabel [m] --ylabel [m]  --default-width 0.5 -i  dumps_0_500.xml,dumps_500_1000.xml --xlim 300,1500 --ylim 1100,2300 --min-color-value -1000 --max-color-value 1000 --min-width-value -1000 --max-width-value 1000 --colormap seismic


And nothing gets colored on the map. I ran the simulation with a random traffic using random_trips.py and with this code for the additional file:

<edgeData id="dumps_0_500" freq="20" file="dumps_0_500.xml" excludeEmpty="true" begin="0" end="500"/>

<edgeData id="dumps_500_1000" freq="20" file="dumps_500_1000.xml" excludeEmpty="true" begin="500" end="1000"/>


The output file looks like this:

image.png


Do you know which may be the problem?


Thanks a lot,

Iulia

_______________________________________________
sumo-dev mailing list
sumo-dev@xxxxxxxxxxx
To unsubscribe from this list, visit https://www.eclipse.org/mailman/listinfo/sumo-dev

_______________________________________________
sumo-dev mailing list
sumo-dev@xxxxxxxxxxx
To unsubscribe from this list, visit https://www.eclipse.org/mailman/listinfo/sumo-dev


--


Das Bild wurde vom Absender entfernt. etti.png

Iulia-Petronela Onică

Student | Faculty of Electronics Telecommunications and Information Technology


+(40) 751 391 832

Skype: onica.iulia26

Alternative e-mail:  iulia.onica@xxxxxxxxx


Das Bild wurde vom Absender entfernt. fb.pngDas Bild wurde vom Absender entfernt. in.png

What you feel is what you become.

_______________________________________________
sumo-dev mailing list
sumo-dev@xxxxxxxxxxx
To unsubscribe from this list, visit https://www.eclipse.org/mailman/listinfo/sumo-dev


Back to the top