[
Date Prev][
Date Next][
Thread Prev][
Thread Next][
Date Index][
Thread Index]
[
List Home]
|
Re: [sumo-dev] plot_net_dump visualization
|
Possibly, you are plotting an empty spatial range. Try running your command without --xlim and --ylim. Also, the tool is located at SUMO_HOME/tools/visualization. If you put it someplace else it may not find it's libraries.
Hello,
I was trying to get a plot using plot_net_dump python script but it seems like nothing is plotted.
I used the following command:
python .SUMO HOME/plot_net_dump.py -v -n pr.net.xml --measures speed,entered --xlabel [m] --ylabel [m] --default-width 0.5 -i dumps_0_500.xml,dumps_500_1000.xml --xlim 300,1500 --ylim 1100,2300 --min-color-value -1000 --max-color-value 1000 --min-width-value -1000 --max-width-value 1000 --colormap seismic
And nothing gets colored on the map. I ran the simulation with a random traffic using random_trips.py and with this code for the additional file:
<edgeData id="dumps_0_500" freq="20" file="dumps_0_500.xml" excludeEmpty="true" begin="0" end="500"/>
<edgeData id="dumps_500_1000" freq="20" file="dumps_500_1000.xml" excludeEmpty="true" begin="500" end="1000"/>
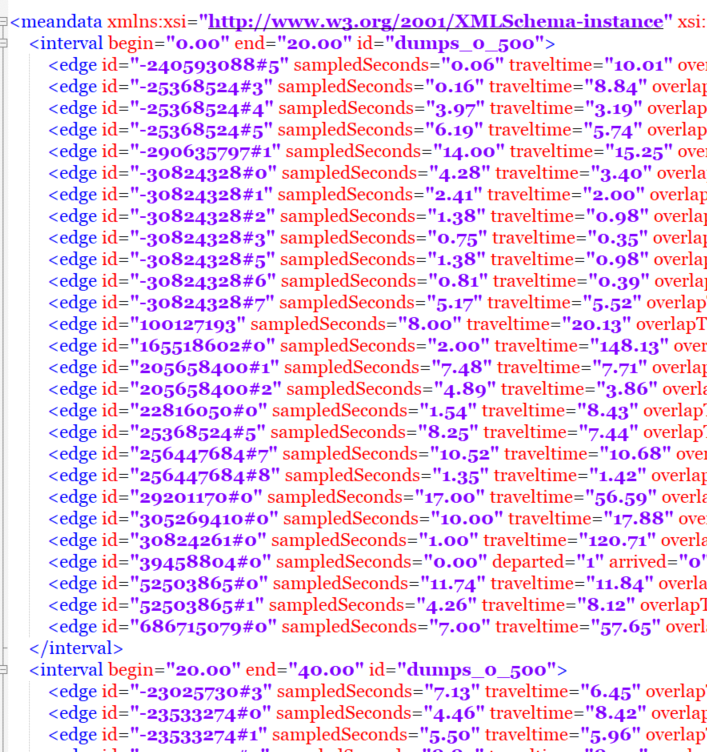
The output file looks like this:
Do you know which may be the problem?
Thanks a lot,
Iulia
sumo-dev mailing list
sumo-dev@xxxxxxxxxxx
To unsubscribe from this list, visit https://www.eclipse.org/mailman/listinfo/sumo-dev