[Date Prev][Date Next][Thread Prev][Thread Next][Date Index][Thread Index] [List Home]
Re: [tracecompass-dev] How To View Live Traces

I'm not able to answer the question about a patch for the LTTng runtime. Alex, do you have more information for this?

Meanwhile, I opened a bug [1] on Trace Compass to handle LTTng 2.4 in live mode correctly. The fix is currently under review for master (Trace Compass 2.0 track). Once it is in I try to include it in the upcoming maintenance release of Trace Compass 1.2.1 coming on March 25th, 2016.

With this fix you will be able to create a live session with Trace Compass and import and view the live trace with Trace Compass. Please note, that even if this fixes the bug, Trace Compass won't be able to connect to an existing live session created on the command-line or created by before a Trace Compass restart when using LTTng 2.4. So, don't restart Trace Compass after creating a live session with it.

Bernd

[1] https://bugs.eclipse.org/bugs/show_bug.cgi?id=489857


On 03/16/2016 03:15 PM, Michael Steppe wrote:
It is not an option for me unfortunately. I am on the 2.6.32 kernel which does not contain the kernel functions needed to build LTTng 2.7 kernel modules. Is there a patch I could apply to our 2.4.4 lttng packages? I may be able to ask the guy who gave me the 2.4.4 kernel modules if he can bump up to 2.5 or 2.6 (assuming they work with our kernel and contain the fix to the problem you listed). Let me know where we can go from here.

On Wed, Mar 16, 2016 at 3:10 PM, Bernd Hufmann <bernd.hufmann@xxxxxxxxxxxx> wrote:
I think I found the problem. Trace Compass doesn't recognize that the session created by Trace Compass is a live session. This happens only for LTTng version 2.4 because, for LTTng 2.4 Trace Compass only relies on the command output of "lttng create --live" to determine whether it's live or not. In LTTng 2.4 the command "lttng list <session>" doesn't provide the live timer interval. Later versions of LTTng do provide this and Trace Compass can use this to determine whether the session is live or not.

This mechanism using the command output of "lttng create <session>" has a bug. Because Trace Compass doesn't recognize the live session the handling of import feature is not correct and that's why you saw the button disabled when the live session was started.

Would it be an option for you to upgrade LTTng to a later version, preferably LTTng 2.7?

Please let me know.
Bernd


On 03/16/2016 01:15 PM, Michael Steppe wrote:
I've also tried starting the live trace through the terminal and then refreshing the control view and importing the trace. I know for certain the trace is live because I get the following output with an "lttng list" showing the network location of the trace:
Inline image 1

On Wed, Mar 16, 2016 at 1:11 PM, Michael Steppe <msteppe91@xxxxxxxxx> wrote:
I tried that as well. The import button is greyed out after clicking the start button. I tried the refresh button after the start and still the import button is greyed out...thoughts?

On Wed, Mar 16, 2016 at 1:09 PM, Bernd Hufmann <bernd.hufmann@xxxxxxxxxxxx> wrote:
This dialog should only show if a trace is created the trace session is configuered for network traces and not in live mode. Not sure why you see this dialog in your case.

Could you please start the live trace first (using the start button) and then press import from the Control view. This should link the trace (with name of the session) into the "Remote" tracing project of  the Project Explorer view? At the same time it should be opened and the views should be updated.

Please let me know how it goes.
Bernd

On 03/16/2016 01:00 PM, Michael Steppe wrote:
Bernd,

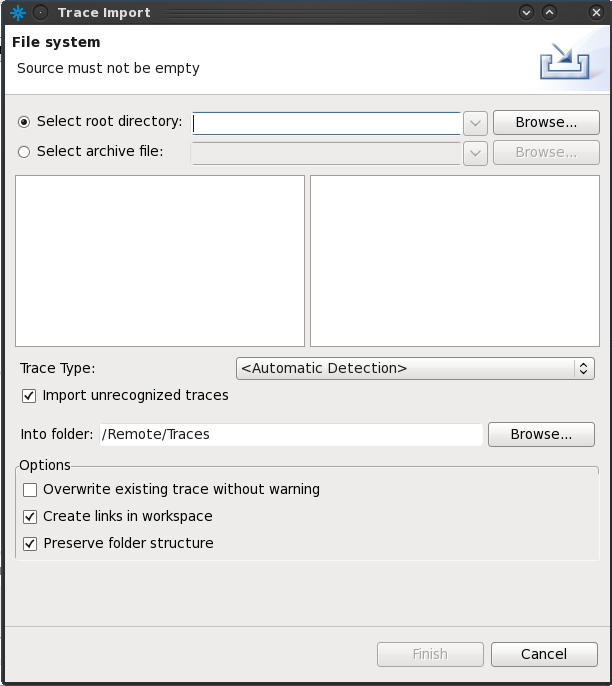
Then how were you able to import the live trace from the LTTng Control view? The screenshot below is the window I get when I click the import button in the control view. How are you able to navigate to the live trace from this window?
Inline image 2

On Wed, Mar 16, 2016 at 12:43 PM, Bernd Hufmann <bernd.hufmann@xxxxxxxxxxxx> wrote:


On 03/15/2016 10:46 AM, Michael Steppe wrote:
Thanks for the reply Alexandre. I've added my user to the tracing group and am testing now. While I am testing, do you or Bernd have any idea how I would navigate to the live trace location through the Import button before it the trace is started and therefore saved to ~/lttng-traces?

Not sure that the trace is created before the trace is started.  Right now there is no direct way in Trace Compass to browse the file system. It's only indirectly possible using the import wizards from the Project Explorer view. But probably that's not what you're looking for.

Bernd


On Tue, Mar 15, 2016 at 10:34 AM, Alexandre Montplaisir <alexmonthy@xxxxxxxxxxxx> wrote:
Hi Michael,

I would recommend against running Eclipse / Trace Compass as root. A large UI application with network access that runs as root, that's just asking for trouble! ;)

If you have sudo access, you should be able to create the group "tracing" and add your user to it:

$ sudo addgroup tracing
$ sudo usermod -a -G tracing yourusername
(login out then back in your session)

That way your user will have access to kernel tracing, and the only component that runs as root will be the lttng-sessiond.

I would suggest to try this next. I don't know if this will also solve your problem, but I know for sure we do not test running Trace Compass as root. Bernd, do you think it could be related?


Cheers,
Alexandre


On 2016-03-14 07:20 AM, Michael Steppe wrote:
I'm sorry Alexandre. I was using Eclipse Luna's built in linuxtools plugin
when I saw the "null argument" error. I just realized my mistake.

That said, I opened the1.2.0  Trace Compass standalone application as root
as was able to enable kernel space events for a live trace. When I click
import in the LTTng Control view, I get this message:

[image: Inline image 1]

Much better than last time! But, after I click OK it asks me to navigate to
the trace location:

[image: Inline image 2]

The issue here is that when I navigate to /root/lttng-traces/localhost, my
session name is not there (not until after the kernel trace is started and
stopped is there a folder for the trace in this location). From what I
understand, when live tracing as root from the command line, the live
traces are saved somewhere like "net://localhost/<session-name>" until the
trace is started and stopped. Babeltrace is able to listen to that location
and view the live-trace *as events roll in*. Is there a way to do this in

Trace Compass or am I just not understanding how the Import trace button
works? You cannot navigate to the "net://...." location through the Trace
Compass Import GUI.

On Thu, Mar 10, 2016 at 10:53 PM, Alexandre Montplaisir <
alexmonthy@xxxxxxxxxxxx> wrote:

On 2016-03-10 01:33 PM, Michael Steppe wrote:

I hope you are able to view the screenshots I add to these messages.

Yep, works fine here! I think the online archive will scrub them though.

   Here
is another which shows an output of loaded kernel modules (which I grep-ed
for 'ltt'):

[image: Inline image 1]

I couldn't get the 2.7.1 Kernel modules to build in CentOS 6.5, so I had
to
downgrade to 2.4.4 (which is documented to still support live tracing).

2.4 is *very* old, and not supported any more upstream. What kernel
version are you using? If LTTng 2.4 works, then LTTng 2.7 should too,
that's strange. You should report it, along with the error logs, to the
lttng-dev mailing list.

I am not even sure if Trace Compass supports live tracing on 2.4. I think
the protocol changed at some point and it's possible we only support later
versions. Bernd could confirm this.

   I
also downgraded my lttng-tools and lttng-ust to 2.4.4 to stay in line with
the kernel version. I am still unable to Import/view any live traces as
they are running. I even attempted to download a fresh version of Eclipse
Luna CDT which has linuxtools installed already. Even that control view
does not allow me to select the kernel domain.

Are you able to take kernel traces on that machine?

As Bernd mentioned, you need special rights to trace the kernel. A very
easy way to test if you have access to kernel tracing is the command "lttng
list -k". If it prints the list of kernel events, you are good to go.
However it should print an error if you don't have the requirements (user
not in the "tracing" group, modules not installed, etc.)

Simply seeing the modules in lsmod doesn't necessarily means your user can
trace the kernel.

If you get an error running "lttng list -k", then it's LTTng that is not
configured correctly, and Trace Compass only shows the available options.
But if the command works, then there might be a bug on the Trace Compass
side. Normally these options are greyed out when the user doesn't have
access to kernel tracing.


   Trying to test the UST
domain as you said would still work, I enabled all UST events and clicked
Import and got a "null argument" error. There was no other details
provided
about the error.

That is also strange, but could be due to using LTTng 2.4.

   Is there any way I could get a screenshot by screenshot
view of how you are importing live traces? Are you creating sessions AND
channels and then enabling events or just creating sessions and enabling
events?

Thanks for all your help by the way. I'm sure it is frustrating trying to
explain something that you know works. I just haven't had any luck the
past
few weeks trying to view live traces graphically (works with babeltrace
but
not very "human readable").

No problem, what is frustrating is that it doesn't work for a user, so we
want to help make it work! :)


Cheers,
Alexandre


Back to the top