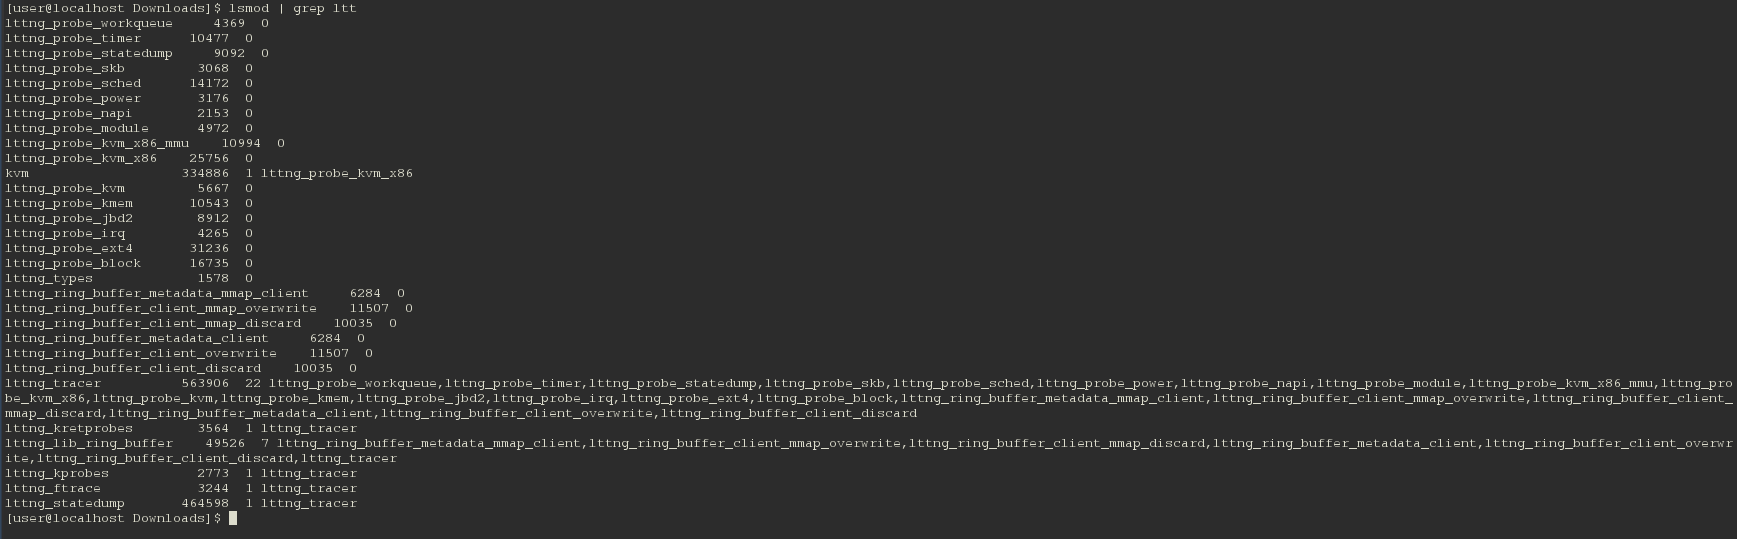
I hope you are able to view the screenshots I add to these messages. Here is another which shows an output of loaded kernel modules (which I grep-ed for 'ltt'):
I couldn't get the 2.7.1 Kernel modules to build in CentOS 6.5, so I had to downgrade to 2.4.4 (which is documented to still support live tracing). I also downgraded my lttng-tools and lttng-ust to 2.4.4 to stay in line with the kernel version. I am still unable to Import/view any live traces as they are running. I even attempted to download a fresh version of Eclipse Luna CDT which has linuxtools installed already. Even that control view does not allow me to select the kernel domain. Trying to test the UST domain as you said would still work, I enabled all UST events and clicked Import and got a "null argument" error. There was no other details provided about the error. Is there any way I could get a screenshot by screenshot view of how you are importing live traces? Are you creating sessions AND channels and then enabling events or just creating sessions and enabling events?
Thanks for all your help by the way. I'm sure it is frustrating trying to explain something that you know works. I just haven't had any luck the past few weeks trying to view live traces graphically (works with babeltrace but not very "human readable").