
Documentation
Step 1 - Use 4diac Locally (Blinking Tutorial)
This page is part of a guide that gives a walk-through over the major 4diac IDE features.
- 4diac IDE Overview
- Use 4diac Locally (YOU ARE HERE!)
- Distribute 4diac Applications
- Deploy Applications Remotely
- Create Your own Function Block Types
- Other Basic Features
- Advanced Features
- Deploying new FBs with the Dynamic Type Loader
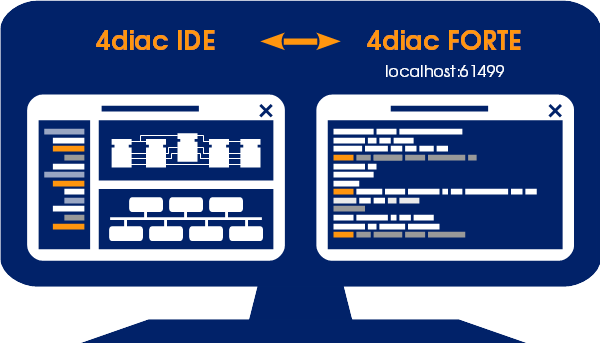
In this tutorial you create a simple Blinking application. It's the "Hello World" of automation programs, so it teaches the key aspects and workflow of 4diac IDE. The application will run locally, so no connection to any PLC or external hardware is needed. The architecture is shown below.
After completing Step 0 switch to the system perspective using the  Button.
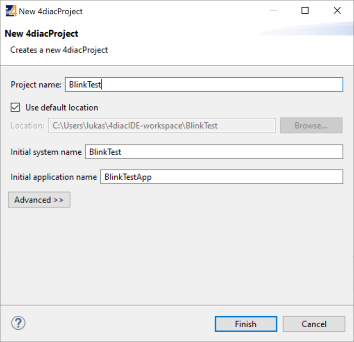
Create a new IEC 61499 System
- In the upper left corner of the system perspective there is the main menu. Create a new project by selecting
- Follow the instructions in the creation wizard. For this tutorial we name our new system BlinkTest.
The system appears in the System Explorer on the left, click on the BlinkTest to unfold the tree. There you can see three things now:
- BlinkTestApp: The automatically generated initial control application. The name can be freely chosen. Your application is located here.
- System Configuration: The definition of the devices present in your System.
- Type Library: You find here all the available Function Blocks for this System.
By default, new systems contain a copy of the types in the Type Library. If different types are needed, for example from another project or another IEC 61499 engineering tool, these type files can be easily added by copying them into the project directory to the desired location. Furthermore the Type Navigator allows to drag and drop types between projects as well as within a project to a different folder.
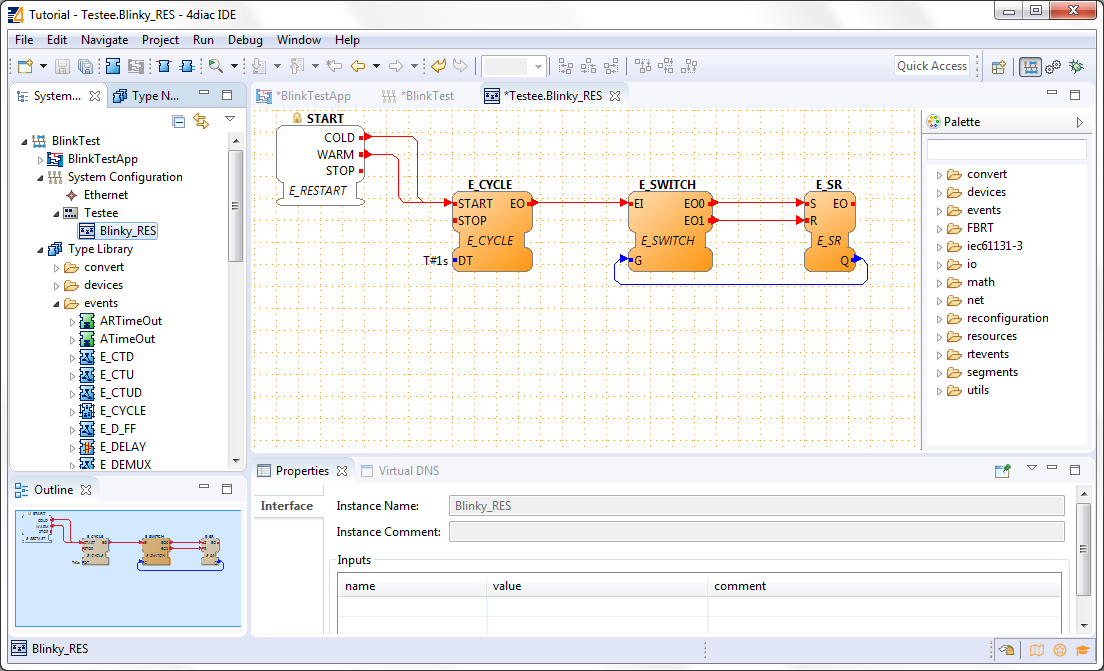
Create a FB Network for the Blink Application
A double-click on an Application in the System Explorer tab on the left opens the Application Editor for this specific application in the editor area.
- Drag and Drop the following Function Blocks (FBs) to the Editor. Open the palette (if not already open) on the upper right of editor area by clicking on the left arrow or use the Type Library in the System Explorer.
The three FBs are in the events folder:
- E_CYCLE
- E_SWITCH
- E_SR
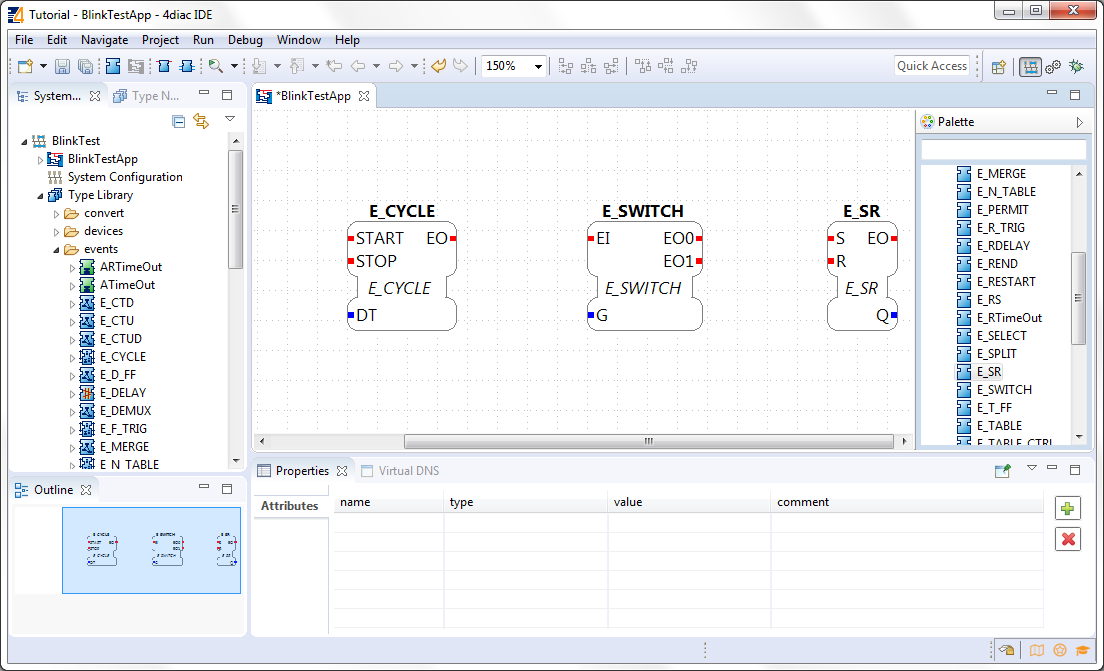
The name in the middle of the FB is its type. If you CTRL + click on it, you can access the definition of the type of the FB. There you can see the interface and how it works. Check E_SWITCH and E_SR and go to the ECC tab to see how they behave.
The name on top of the FB is the instance name. Two FBs cannot have the same instance name. You can double-click on it to change it for a better organized application.
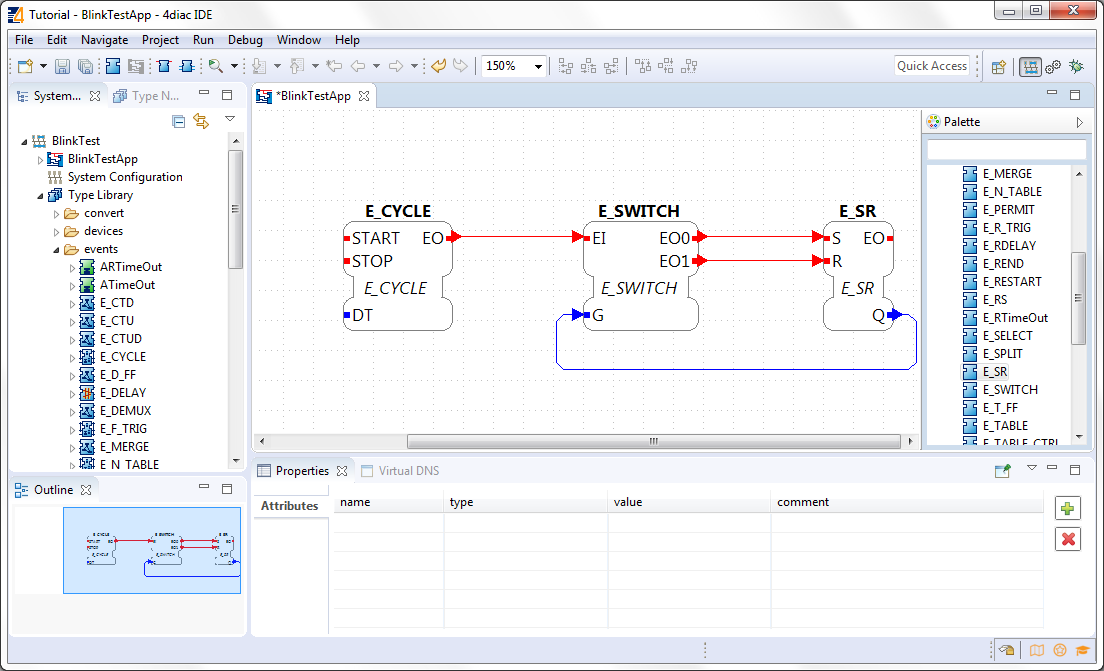
- Create the connections between the FBs
Event (red, on top part of FBs) and Data (blue, on lower part of FBs) connections can be generated by connecting the Event-/Data in- and outputs. Position the mouse pointer over an Event-/Data in- or output, click and drag to the other end of the connection to create one. Remember, Event and Data connections cannot be mixed. Events connections allow fan-in and fan-out. Data connections allow fan-out but not fan-in.
Here are some tips for editing the application:
- If you hover the mouse over a FB or Data or Event connection end, you'll get information about it.
- If you try to connect Data connections that have incompatible types, you will see a red error in the status bar at the lowest part of 4diac-IDE.
- Selected function blocks in the Application Editor can be parameterized using the Properties View typically located below.
- The colors of the connections may differ. Remember you can change them in
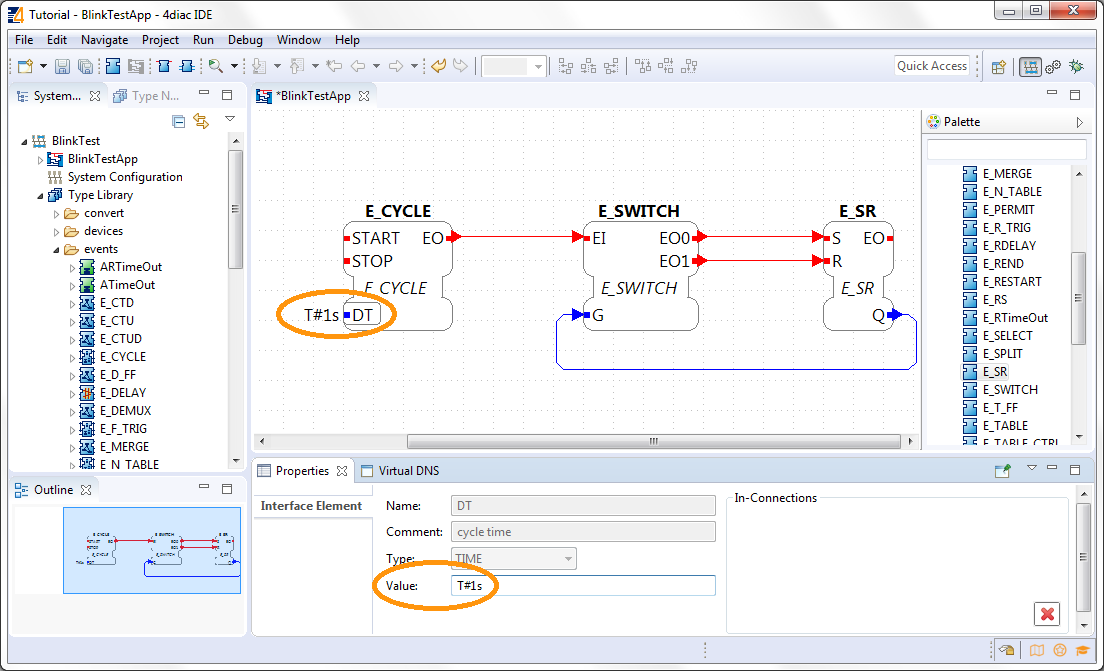
- Set a literal as an input data connection. The DT input data connection of E_CYCLE must be set to a value in order for it to work. You can do it by either:
- Double click on the data connection in the Application Editor
- Select the DT of the FB and change the value in the Properties tab below or double-click on DT and set the value directly
Set the value to T#1s, meaning 1 second.
Now the application is done. You should try to understand how the application works. Something missing is the starting event. This would be done later when the hardware is configured. For now, imagine an event arrives to E_CYCLE.START. Every 1 second, an event output will be triggered in E_CYCLE.EO. The E_SWITCH will trigger an event output EO0 when G is zero, and EO1 when G is one. The value Q of E_SR will be 1 when an event at S arrive and 0 when an event at R arrive. Try to follow the flow of events and understand why this application makes Q toggle, considering it starts at 0.
Configuration of the Automation Hardware
First, let's define the devices that are present in our system. The automation hardware can be modelled with the System Configuration Editor. It can be opened by double clicking on the System Configuration tree node in the System Explorer on the left. By using Drag and Drop, Device, Resource and Segment types can be added from the palette. On an IEC 61499 Device several IEC 61499 Resources can be configured. Resources can be directly added to Devices.
Drag and Drop a
- FORTE_PC Device
- Ethernet Segment
from the Palette.
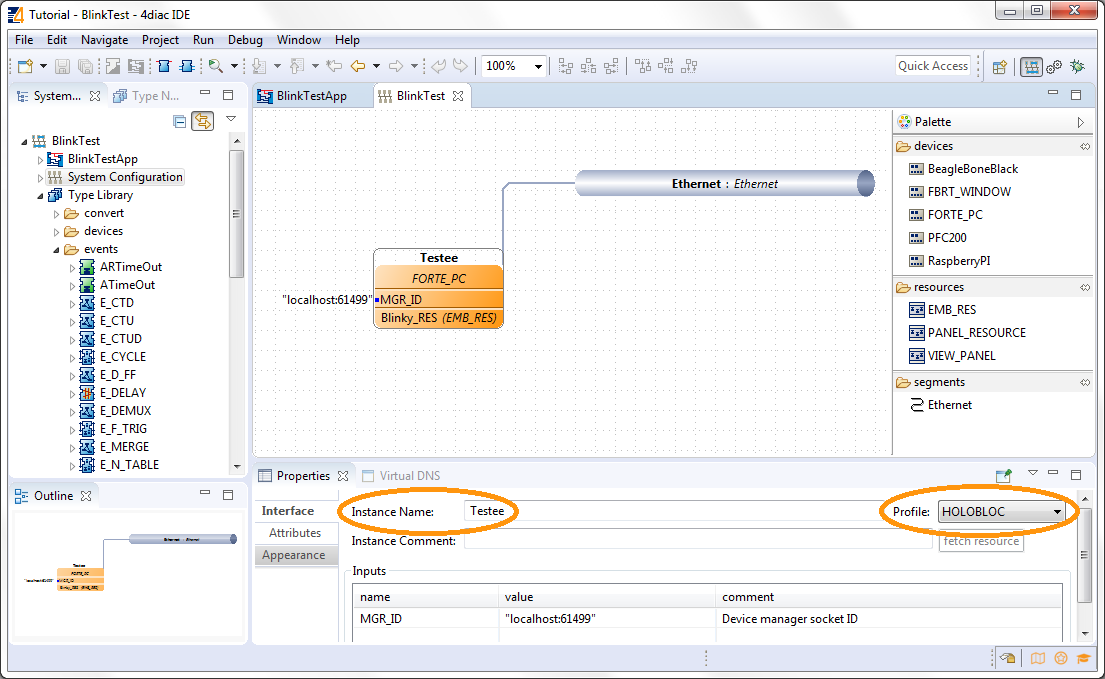
Connect them by clicking on one and dragging to the other. The segment is divided in two areas, the left is for moving, the right for connections. The device can be connected by clicking on the device type (second row). One EMB_RES resource is already present in the device. The MGR_ID localhost:61499 specifies the IP:PORT where the device will run. In this case it'll run locally and will listen at the port 61499.
The color is automatically generated for better orientation in the system. When several devices or segments are in use, you can see at a glance where the FB belongs to. If you like to change the color, click on the device or segment. In the property view on the bottom of the screen you find the tab Appearance. Here you can choose a color you like best.
Check that the Profile in the Properties tab is set to HOLOBLOC.
For this tutorial we give the device the name testee.
Device names help us to distinguish the different devices from each other.
Names can be changed in the property view or by double-clicking on the name.
The resource is automatically generated for your convenience. EMB_RES stands for Embedded Resource.
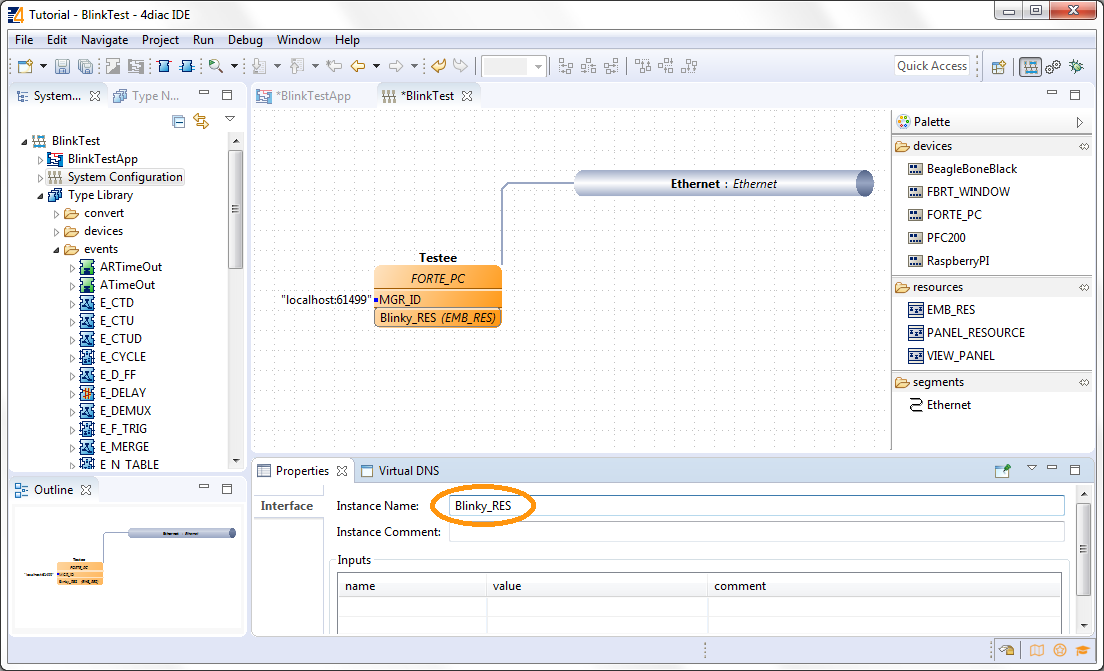
We named it Blinky_RES.
Device and Resource parameters can either be specified directly at each Device/Resource or via the Properties View. The Properties View shows the parameters of a IEC 61499 Device/Resource (if it is selected either in the System Configuration Editor or in the System Manager View). The most important parameters are the IP address and the port of the device management interface as they are required for the communication between the engineering tool and the Devices (e.g. Download of IEC 61499 Applications).
Configuration of the Device's Configuration Profile
In order to support different device vendors' download mechanism you need to specify the device profile to be used for your device. currently 4diac-IDE supports the following two device profiles:
- HOLOBLOC Device conforming to the "IEC 61499 Compliance Profile for Feasibility Demonstrations". Currently the devices supporting this profile are all FORTE devices and FBDK devices older than 2009.
- FBDK2 for FBDK devices version 2 or later.
Mapping of Function Block Networks to Devices/Resources
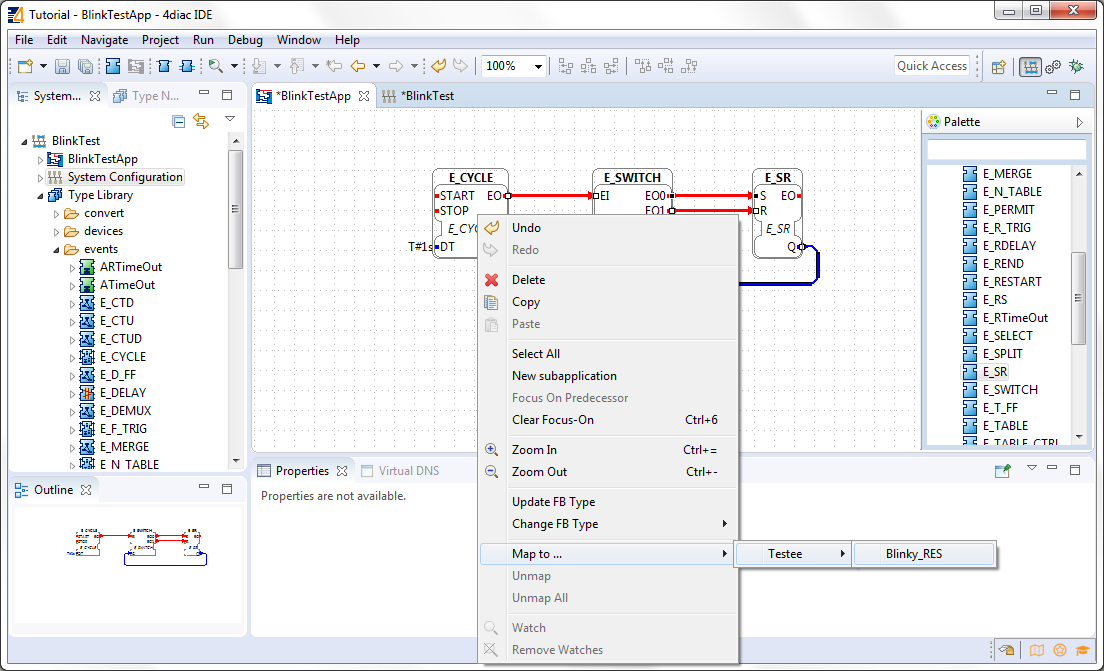
Mapping FBs means defining in which device each FBs will run. All mapped FBs are changing their fill color to the device's color during the mapping process.
Go to the Application created before, select the FBs you want to map by left-clicking or drawing a rectangle over it (in this case all of them),
To unmap a Function Block instance from a Resource, use the context menu entry of a Function Block in the corresponding .
Configure the Resource
You can open the Resource Editor by double clicking the Resource (Blinky_RES) in the System Configuration, or in the tree in the System Explorer on the left.
There you can find a START function block in white. This is the default starter function block of the EMB_RES. This will trigger a COLD event when starting. The STOP is triggered when the PLC is set to a STOP state, and the WARM when the PLC changes from a STOP state back to a RUN state. Connect both COLD and WARM to E_CYCLE.START.
You also see the FBs that were previously mapped. You can add more FBs directly here and they will be already mapped to the resource, or you can unmap the FBs.
Overview of the Editors
Before we test our application, let's briefly summarize the elements we've worked with.
| Element | Creation | Editation | Tutorial Name |
|---|---|---|---|
| System | new System | only children can be edited | BlinkTest |
| Application | first is automatically generated, furthermore via menu | Application Editor | BlinkTestApp |
| System Configuration | automatically generated, only one per system | System Configuration Editor | |
| Device | System Configuration Editor | System Configuration Editor | Testee |
| Resource | System Configuration Editor | Resource Editor | Blinky_RES |
Deploying Application to 4diac FORTE
In this step, the Blink application will be deployed to 4diac FORTE running locally on your computer.
- You have to select a 4diac FORTE.
You can either build your own 4diac FORTE as shown here or you can download the 4diac FORTE that is provided for you for this tutorial on our Homepage. You can save the .exe wherever you like, we have chosen F:\4diac\4diac-ide\. Go to , and in FORTE Location look for the 4diac FORTE and then click Apply and Close.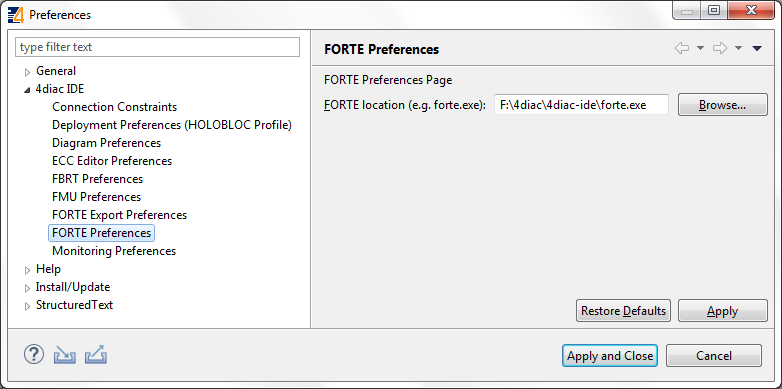
- Change to the Deployment Perspective using the
 button.
 - Set the port to 61499 (the same define before, remember localhost:61499 in the System Configuration?)
- You should see the the location of your 4diac FORTE and the Terminate button enabled in the Console.
- Select the elements to deploy. For this tutorial select our device Testee. In case you have many devices with many resources, you can select the devices to deploy and even which resources to deploy.
- Click the button
- Check that the Deployment Console shows some output, and that no red warning appears on the right nor left of it. If you get something red, something went wrong.
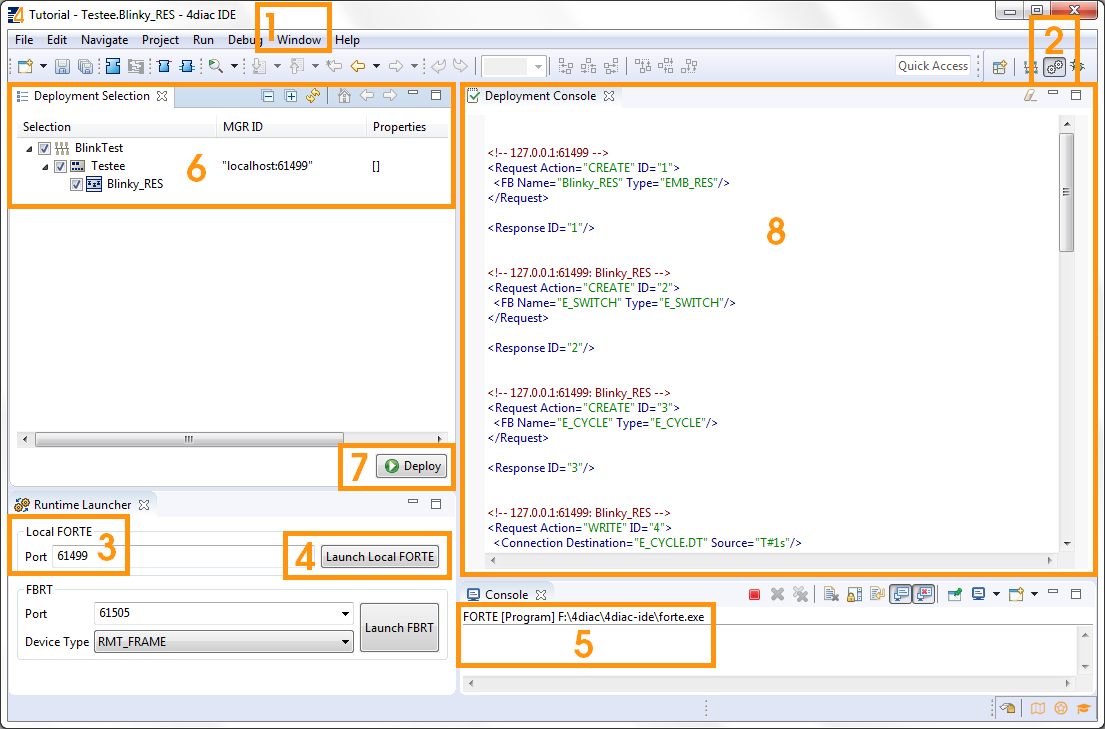
Note: With the runtime launcher you can only start run-time environments on your local development computer. It is not possible to start run-time environments on remote computers or control devices. In order to perform this task device specific means to start the run-time environment have to be performed.
The Deployment Console is automatically cleared before each download.
Furthermore, with the icon  in the upper right corner of the Deployment Console the deployment messages can be cleared.
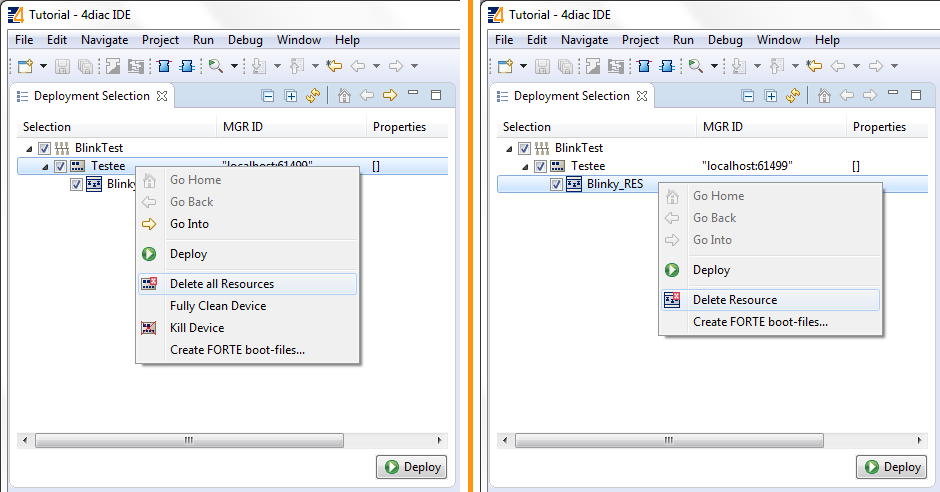
By selecting a Device or Resource the corresponding IEC 61499 element can be cleaned. This means that the Device or Resource configuration are cleaned and reset to the default configuration without any Function Block Network.
leaves the Device empty, and stops 4diac FORTE. You can deploy again after cleaning the Device.
deletes just the selected resource:
Monitoring the Application
To observe the outputs of your Application you can use 4diac's monitoring functionality. You can enable it in the Toolbar under the Toolbar icon:  or doing the following:
- Change to Debug Perspective using the
 button.
 - In the System Explorer, right click on the System → Monitor System
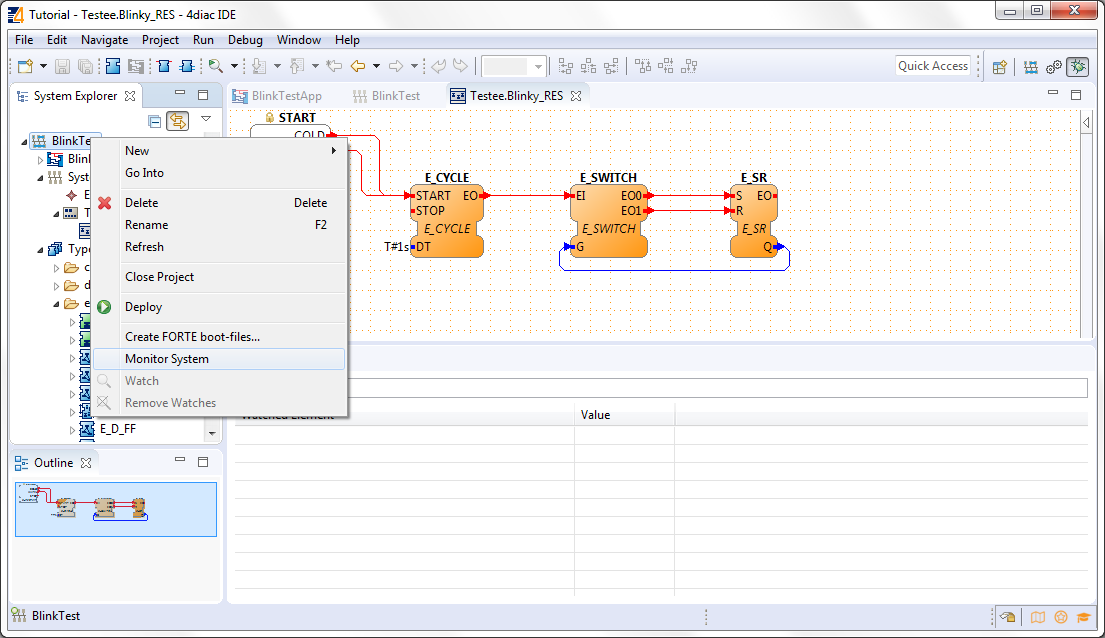
A green circle will appear in the system icon indicating that monitoring is enabled for the system. To watch variables, you can:
- Right Click on a or
- Right Click on a
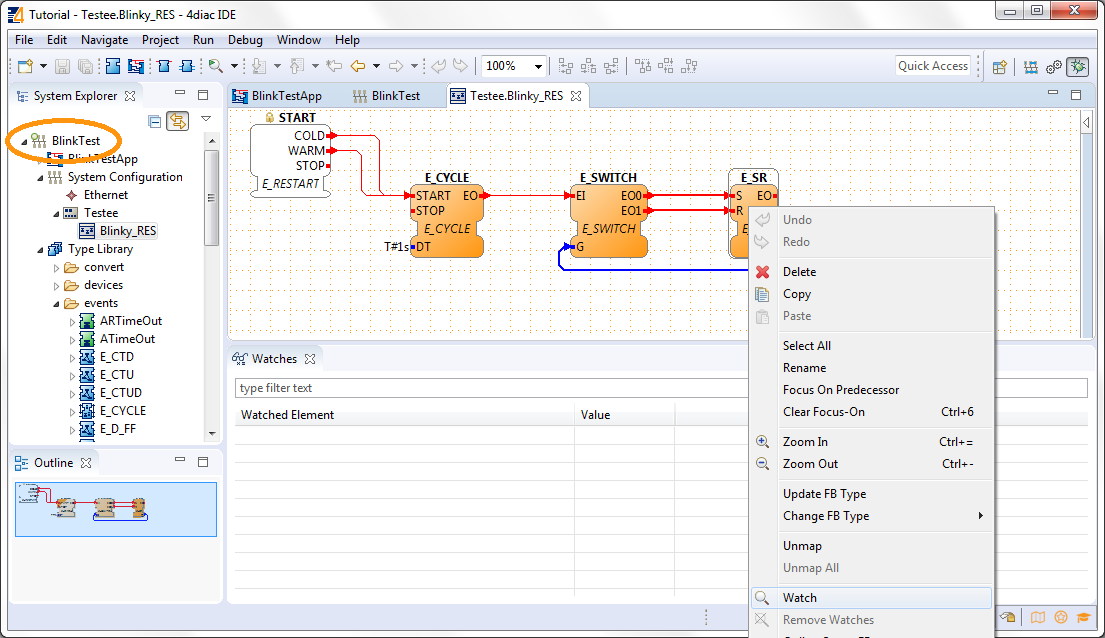
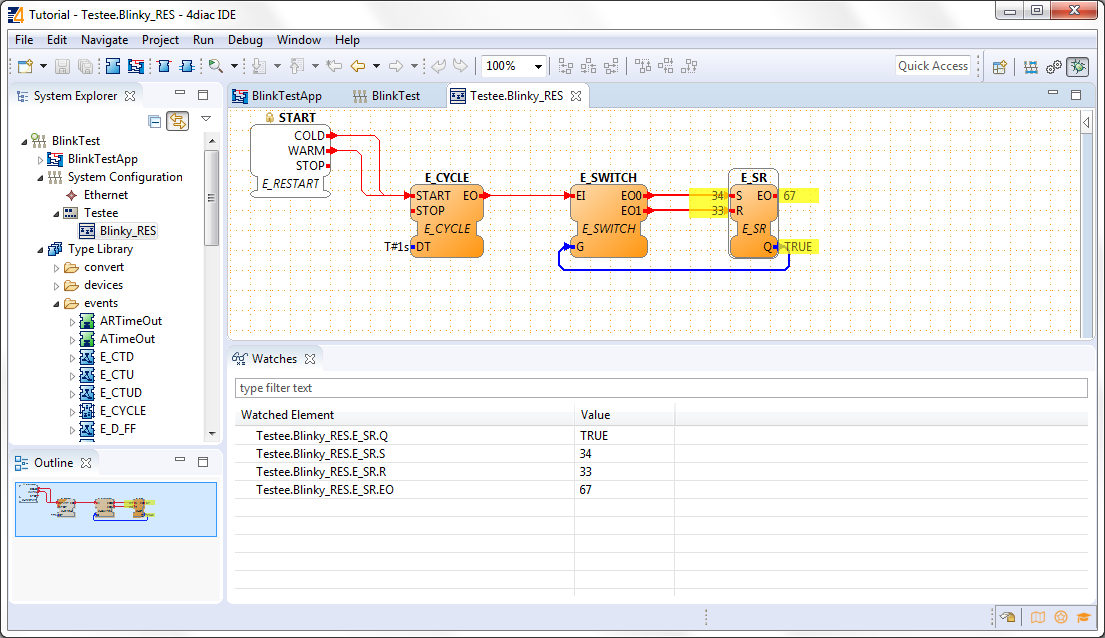
The Data and Events are monitored. The Data shows the current value and the Events show the times it was triggered. You can watch on the directly on the Element or in the Watches view.
Now you can see that true and false alternate. If a controller output were connected, a light would now blink at 1 second intervals.
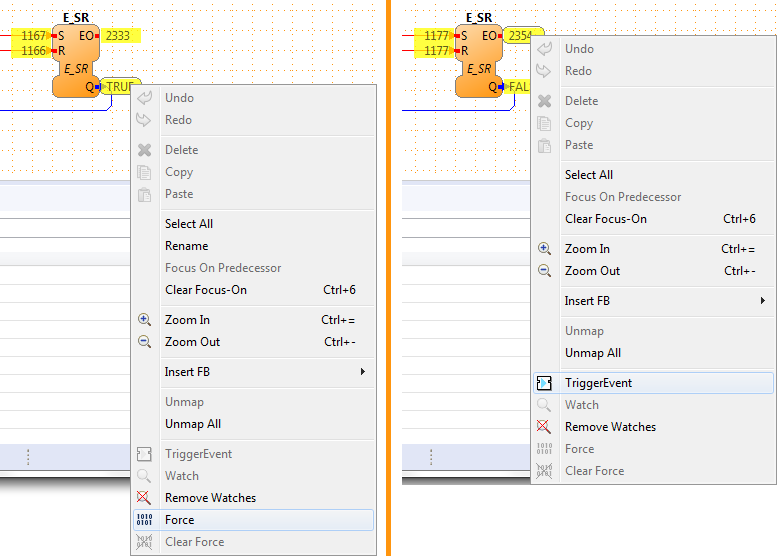
You can force values to data inputs and trigger events by right clicking on it and selecting the corresponding command.
Where to go from here?
Now that you know how to do a centralized solution, let's try and distribute things:
Step 2 - Distribute 4diac Applications
If you want to go the back to see an overall overview of 4diac IDE, here's a link
If you want to go back to the Start Here page, we leave you here a fast access