You are right! and no, you have done nothing wrong. It's just us who were using deprecated classes for those views and it had the effect of ignoring the style. I made a patch to fix that here [1]. Once it is in, you can update the scripting plugins and it
will work.
Hi Geneviève,
thanks for your quick answer!
I already tried the other Views, but they all look the same.
I’ve used this example (http://www.versatic.net/tracecompass/introducingEase.html ) to create my script.
So I just added all my measurements using
quark = ss.getQuarkAbsoluteAndAdd("" + tid + "/" + comm);
org.eclipse.tracecompass.statesystem.core.StateSystemBuilderUtils.incrementAttributeLong(ss, timestamp, quark, value);
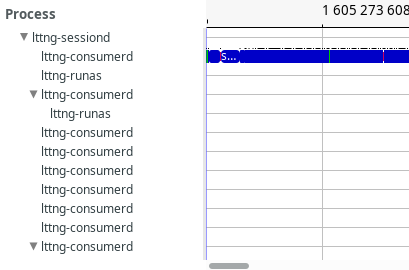
Have I done something wrong? Do I have to remove the quark attributes, like its done in the state system?
See my attachment below.
Best regards
Phil
Hi Phil,
Thanks for your interest in the scripting modules! Your views look great!
I'll answer inline below.
On 2020-11-10 7:48 a.m., tracecompass developer discussions wrote:
Hi,
I am currently using EASE Scripting 0.7 to analyze some LTTNG CTF traces and I have some questions regarding the visualization of the trace data.
Is it possible to modify the color of the arrows created by createArrow() or the color of the different states in the state system?
It is not possible to easily change the colors from the script, either for the state or arrows. Recent modifications to the style API for time graph data provider would make it relatively easy to add
this support, at least for state. I'm not sure of the style/color status of arrows though.
Can the arrows be annotated with a small comment?
I do not think so. Maybe Patrick who has worked a lot recently in the time graph vie has a better answer?
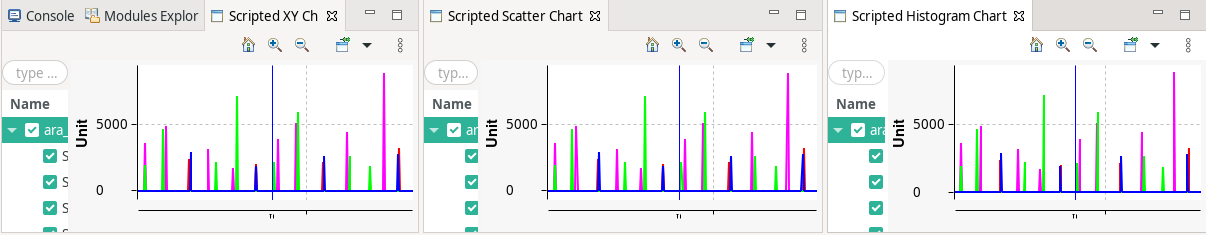
And finally my last question, when I use the XY Chart, the data is presented using an line graph. Can I change this to something like a point or asterisk?
Yes! See the documentation for the ViewModule [1]. You can open your view using the openHistogramChartView or openScatterChartView with the same data provider as the openXYChartView.
[1]
https://archive.eclipse.org/tracecompass.incubator/doc/javadoc/apidocs/org/eclipse/tracecompass/incubator/scripting/ui/views/ViewModule.html
Do not hesitate if you have any more questions on the scripting for Trace Compass!
Best regards,
Geneviève
_______________________________________________
tracecompass-dev mailing list
tracecompass-dev@xxxxxxxxxxx
To unsubscribe from this list, visit https://www.eclipse.org/mailman/listinfo/tracecompass-dev