[Date Prev][Date Next][Thread Prev][Thread Next][Date Index][Thread Index] [List Home]
[tracecompass-dev] EASE Scripting Visualization

Hi,

I am currently using EASE Scripting 0.7 to analyze some LTTNG CTF traces and I have some questions regarding the visualization of the trace data.

Is it possible to modify the color of the arrows created by createArrow() or the color of the different states in the state system?

Can the arrows be annotated with a small comment?

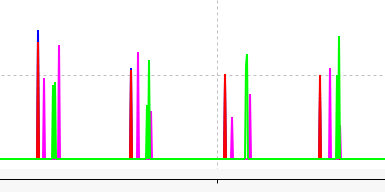
And finally my last question, when I use the XY Chart, the data is presented using an line graph. Can I change this to something like a point or asterisk?


I will attach some of the graphs i want to modify.


Thanks in advance

Phil


Back to the top