[
Date Prev][
Date Next][
Thread Prev][
Thread Next][
Date Index][
Thread Index]
[
List Home]
|
Re: [sumo-user] Queue Analysis
|
Yes, that's correct.
-----Original-Nachricht-----
Betreff: Re: [sumo-user] Queue Analysis
Datum: 2025-02-21T13:33:25+0100
Von: "Pedro Oliveira" <pedro.engenhariae@xxxxxxxxx>
An: "Mirko Barthauer" <m.barthauer@xxxxxxxxxxx>
Good morning! I will use the occupancy data obtained from lane data. I would just like to really understand the concept: It is the average percentage of the length of the road that was occupied by stopped vehicles. Correct?
Good morning! For these detectors, is there a minimum desirable length that we could adopt?
The goal would be to have an indicator as an average data of the network that represents an idea of congestion. We are using others such as: Density, timeloss, waiting time, waiting (total number of vehicles not inserted), average speed. In practical terms, since it is an average and general value of the network, the goal is to compare its variation in different scenarios.
As an alternative to queues, I can use detectors at specific points. I will study the outputs that are generated. The first step would be to understand how it understands congestion.
Sds,
Pedro Oliveira
Your network consists of some freeway with enter/exit ramps and two roundabouts. This is beyond the scope of the queue output described in the documentation as:
"The idea behind this output option is to detect the queue in front of the controlled/uncontrolled junction. The queue length is calculated using the end of the last standing vehicle."
Queuing_length considers stopped vehicles, queuing_experimental those below 5km/h and at least a position of 1/4 of the edge length according to the source code.
As the cars do not really stop there like at a controlled junction, the computed queue values do not make much sense. Maybe the last arrived vehicle has to stop for one time step before accelerating again. This should explain the changes from high numbers to 0 in one time step. What do you actually want to obtain? Lanearea detectors can compute jams as well (and across edge borders).
Best regards,
Mirko
-----Original-Nachricht-----
Betreff: Re: [sumo-user] Queue Analysis
Datum: 2025-02-19T15:26:53+0100
Von: "Pedro Oliveira" <pedro.engenhariae@xxxxxxxxx>
An: "Mirko Barthauer" <m.barthauer@xxxxxxxxxxx>
Hi Pedro,
this does look quite different from our test simulations using the queue output. Could you provide a small test scenario where similar queue output as shown below can be seen?
Best regards,
Mirko
-----Original-Nachricht-----
Betreff: [sumo-user] Queue Analysis
Datum: 2025-02-18T22:28:35+0100
Von: "Pedro Oliveira via sumo-user" <sumo-user@xxxxxxxxxxx>
An: "Sumo project User discussions" <sumo-user@xxxxxxxxxxx>
Good evening,
I am performing a queue analysis. I would like to better understand how the data is computed.
From what I understand, queueing_length is the intersection point (start of the edge) to the last vehicle with a speed lower than 5 km/h and queueing_length_experimental is the length from vehicle to vehicle. Is this the correct understanding?
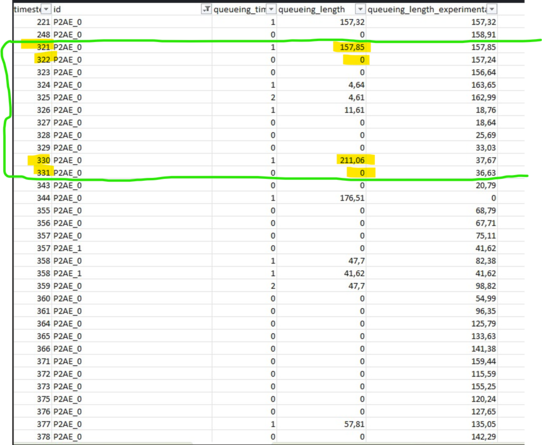
I would like to better interpret the simulation output. When analyzing only queue_length from instant 321 to 331, for example, the queue goes from 157.85 to 0 in 1 second from instants 321 to 322 and from 211.06 to 0 from instant 330 to 331.
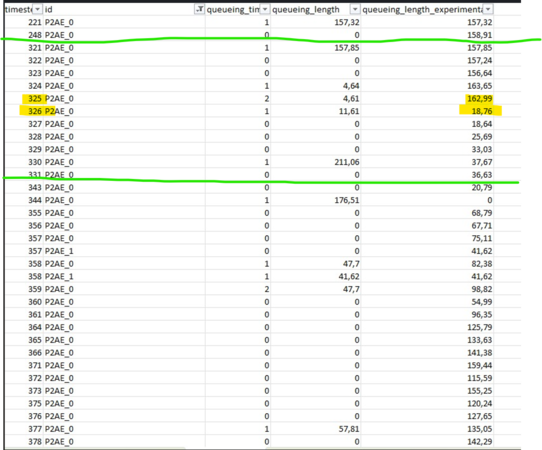
When analyzing queueing_length_experimental it seems to remain a little more constant, but it still has jumps (325/326).
Another issue is that to get the average queue I need to consider the moments when there are no queues, that is, a value equal to zero. However, if at that moment there are no queues in either of the two, it will not appear. Is there any other resource that informs the queues from 0 to 3600, also showing the moments when they were 0?
Sds,
Pedro Oliveira