Good evening,
I am performing a queue analysis. I would like to better understand how the data is computed.
From what I understand, queueing_length is the intersection point (start of the edge) to the last vehicle with a speed lower than 5 km/h and queueing_length_experimental is the length from vehicle to vehicle. Is this the correct understanding?
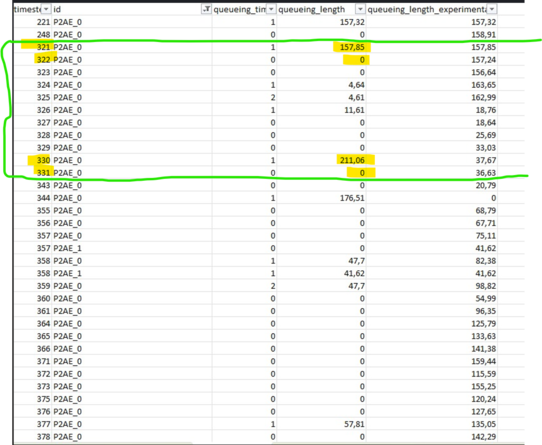
I would like to better interpret the simulation output. When analyzing only queue_length from instant 321 to 331, for example, the queue goes from 157.85 to 0 in 1 second from instants 321 to 322 and from 211.06 to 0 from instant 330 to 331.
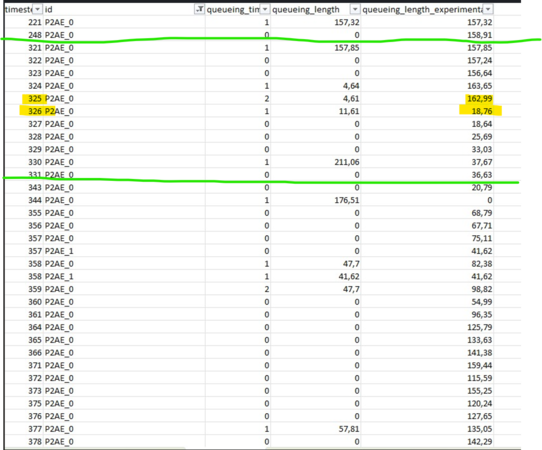
When analyzing queueing_length_experimental it seems to remain a little more constant, but it still has jumps (325/326).
Another issue is that to get the average queue I need to consider the moments when there are no queues, that is, a value equal to zero. However, if at that moment there are no queues in either of the two, it will not appear. Is there any other resource that informs the queues from 0 to 3600, also showing the moments when they were 0?
Sds,
Pedro Oliveira