[
Date Prev][
Date Next][
Thread Prev][
Thread Next][
Date Index][
Thread Index]
[
List Home]
|
Re: [sumo-user] View Traffic value on the link
|
In the settings dialog, activate the checkbox "show edge color value". You can customize size, color and background color of the text.
Thank you very much. I'm now going to look for how to place the text in each edg, I'm still having difficulty.
Sds,
Pedro Oliveira
Hi,
you can colour the edges by several kinds of measures and display the corresponding numerical value using the visualisation settings of sumo-gui. First configure edgeData recording and then choose to colour the edges by (live) edgeData (select "left" as measure). Keep in mind that the value is related to the period you choose (not necessarily per hour)!
Best regards,
Mirko
-----Original-Nachricht-----
Betreff: [sumo-user] View Traffic value on the link
Datum: 2024-11-25T15:10:41+0100
Von: "Pedro Oliveira via sumo-user" <sumo-user@xxxxxxxxxxx>
An: "Sumo project User discussions" <sumo-user@xxxxxxxxxxx>
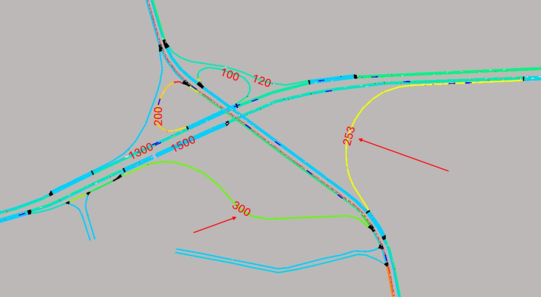
Good morning!
I would like to know if it is possible to print the simulation with the value of the traffic volume, it would be something like this.
Thank you very much for your attention.
Best regards,
Pedro Oliveira
sumo-user mailing list
sumo-user@xxxxxxxxxxx
To unsubscribe from this list, visit https://www.eclipse.org/mailman/listinfo/sumo-user
sumo-user mailing list
sumo-user@xxxxxxxxxxx
To unsubscribe from this list, visit https://www.eclipse.org/mailman/listinfo/sumo-user