[
Date Prev][
Date Next][
Thread Prev][
Thread Next][
Date Index][
Thread Index]
[
List Home]
|
Re: [sumo-user] Regarding average speed in Edge based traffic measures
|
Is it possible to get summary output for a specific group of edges rather than the whole network?
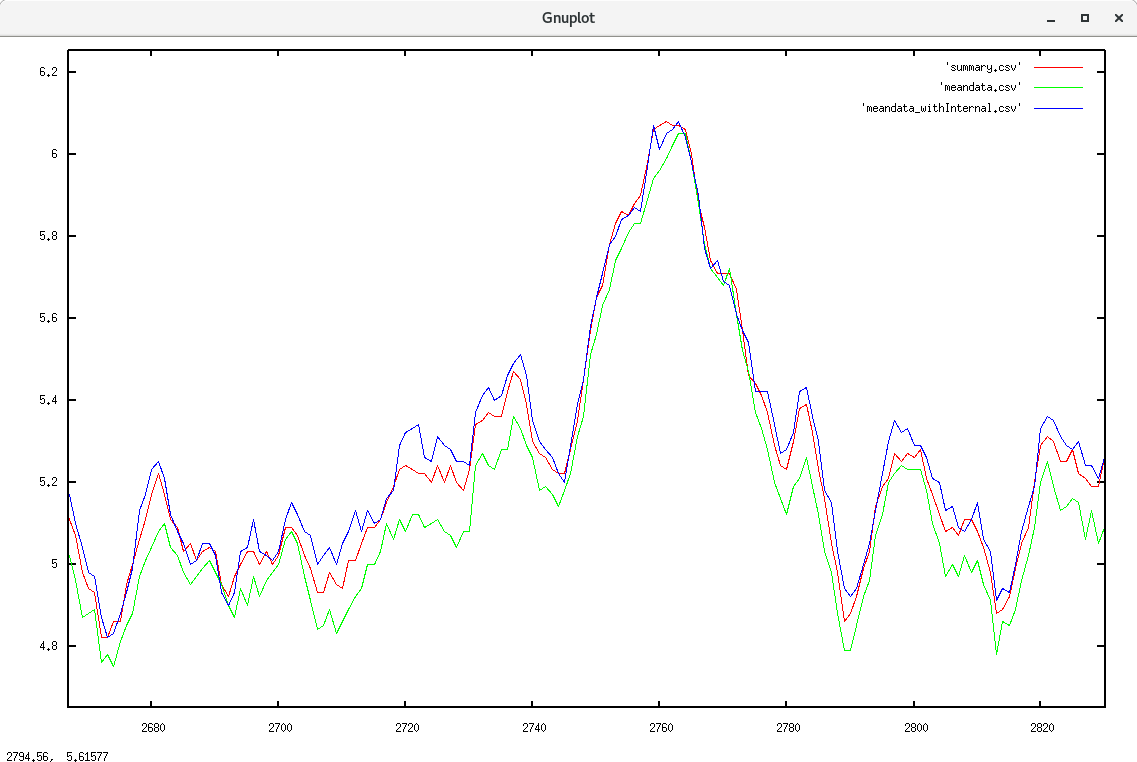
The closer you look the more details you'll find (data obtained with option --csv-output from plotXMLAttributes.py):
- summary / sumo-gui values include vehicles that were inserted in the current step whereas edgeData only includes vehicles that already moved in the network
- summary output does not include vehicles that exited the simulation in the current step whereas edgeData does
- edgeData output doesn't include internal edges by default
This clears a lot of things. In my scenario, when there are no empty edges, then the values for both methods are exactly the same. However, the difference becomes significant when there are a lot of empty edges. Like in the first 3600, vehicles use only 12 out of 36 edges, and in this case, the first method gives an average speed of 3-4m/s, which is intuitive; however, the aggregated value for this time interval is 11m/s.
I'll study the traffic more if doubt still exists, I'll share the scenario.
Thanks a lot.
"If we aggregate all the edges in the edgeData file, then the average speed should be the same as that obtained through SUMO."
Mostly yes, though there are probably some differences at the margins (i.e. summary mean speed gives -1 to indicate when there are no vehicles in the network anymore).
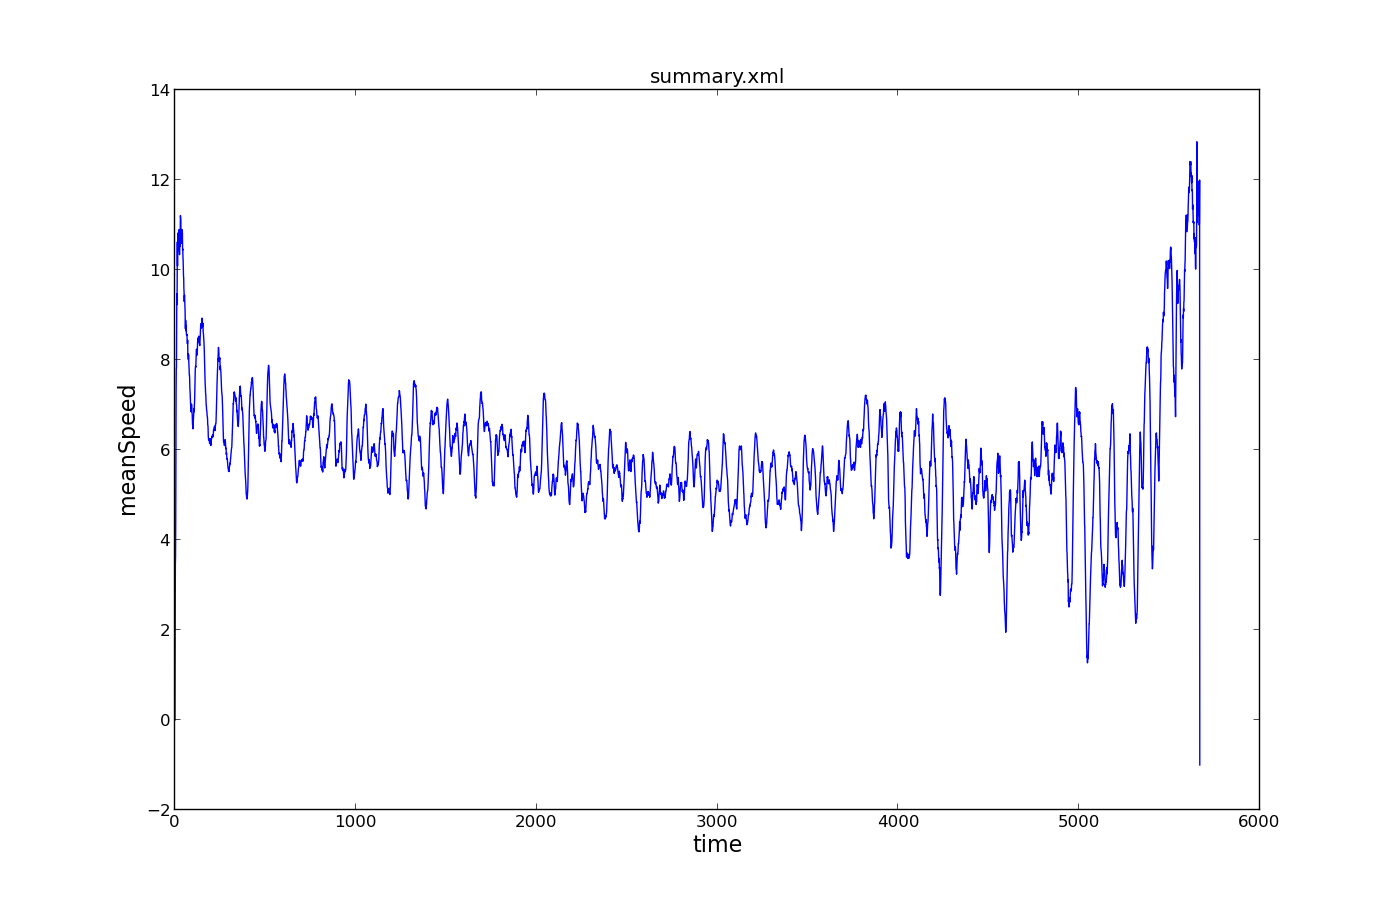
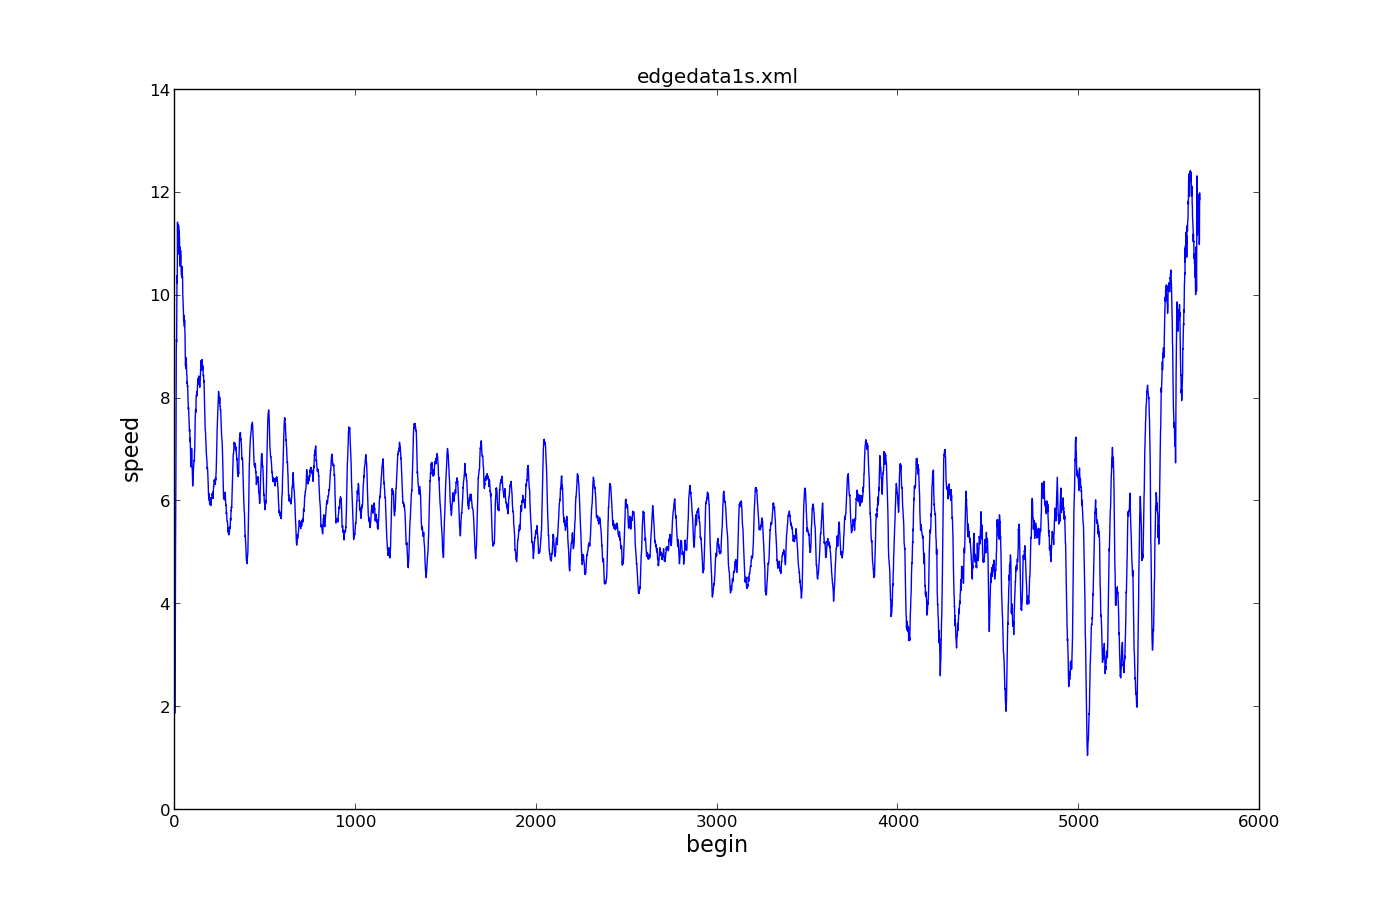
Below I have 2 plots from the same scenario:
1. sumo ... --summary-outputs summary.xml (these are the same values that are plotted in sumo-gui)
tools/visualization/plotXMLAttributes.py summary.xml -x time -y speed -s
2. with <edgeData id="1s" period="1" file="edgedata1s.xml" aggregate="true"/>
tools/visualization/plotXMLAttributes.py edgedata1s.xml -x begin -y speed -s
If you suggest, I can share my scenario files with you. Meanwhile, kindly tell me if this is correct: "If we aggregate all the edges in the edgeData file, then the average speed should be the same as that obtained through SUMO."
Thanks,
It's hard to tell without seeing the traffic patterns but there could be complex interactions due to intersections and whatever the rerouters are doing. Observing the scenario while it runs is usually the best way to figure these things out. It also helps to set vehicle coloring to "by speed".
I have attached a screenshot for your reference.
I have rechecked all my edges, and all the units are in m/s. The simulation scenario is for 39600-time steps, where initially vehicles enter from one edge and get out at another, travelling with maximum allowable speed but only using some of the edges of the network. After about 3600 timesteps, a few more vehicles enter, but now they use all the edges and may slow down or stop based on traffic conditions. In this scenario, the average speed for initial 3600 timesteps, the average speed is around 3-4m/s, while after 3600, it goes up to 7-8m/s, which I find counterintuitive. Hence I tried matching it with edgeData file values.
This sounds like a km/h vs m/s mismatch. If you define your edges with 16km/h than the average speed would typically be a bit lower i.e. ~14 km/h (due to random slow-downs and interactions of vehicles with different desired speeds). This would then be presented to you by sumo as ~3.8 m/s .
Dear community,
Regarding the previous discussion on average speeds in SUMO, I have encountered another setback. Earlier I was using SUMO-GUI to generate a graph of the average speed of the whole network (at 5-minute intervals) and save it as a CSV file. Then I thought that if I got aggregated average speed of all the edges in the network, it should be equal to the values obtained from SUMO-GUI, but this is not the case. Could you explain how the average speed for the whole network is calculated and how I can get the same values through the edgeData file?
I wanted to compare these values as even though I had a max allowable speed of 16 and the vehicles were free-flowing, the average speed in SUMO-GUI would be around 3-4.
Thanks and regards,
Rohan
The speed value is computed as travelledDistance / sampledSeconds.
You should be able to replicate the aggregated speed value by the following procedure:
- for each edge compute travelled distances as speed * sampledSeconds
- sum up the distances and sampledSeconds
- take the quotient of the sums
Dear community,
I have been trying to understand how the average speed is calculated in edge-based traffic measures. I know it is space-mean speed but I am trying to aggregate data for multiple edges.
I first generated average speed of two edges using edges="" and aggregate="True" method, then I generated average speed of the two edges separately. Now, I have tried arithmetic mean, harmonic mean, weighted average by numbers but cannot get the value equal to the aggregated value given by SUMO.
Kindly suggest in what way can I manually aggregate the average speed data so as to get same value as when being done by aggregating directly through SUMO.
Thanks and regards,
Rohan
sumo-user mailing list
sumo-user@xxxxxxxxxxx
To unsubscribe from this list, visit https://www.eclipse.org/mailman/listinfo/sumo-user
sumo-user mailing list
sumo-user@xxxxxxxxxxx
To unsubscribe from this list, visit https://www.eclipse.org/mailman/listinfo/sumo-user
sumo-user mailing list
sumo-user@xxxxxxxxxxx
To unsubscribe from this list, visit https://www.eclipse.org/mailman/listinfo/sumo-user
sumo-user mailing list
sumo-user@xxxxxxxxxxx
To unsubscribe from this list, visit https://www.eclipse.org/mailman/listinfo/sumo-user
sumo-user mailing list
sumo-user@xxxxxxxxxxx
To unsubscribe from this list, visit https://www.eclipse.org/mailman/listinfo/sumo-user
sumo-user mailing list
sumo-user@xxxxxxxxxxx
To unsubscribe from this list, visit https://www.eclipse.org/mailman/listinfo/sumo-user
sumo-user mailing list
sumo-user@xxxxxxxxxxx
To unsubscribe from this list, visit https://www.eclipse.org/mailman/listinfo/sumo-user
sumo-user mailing list
sumo-user@xxxxxxxxxxx
To unsubscribe from this list, visit https://www.eclipse.org/mailman/listinfo/sumo-user
sumo-user mailing list
sumo-user@xxxxxxxxxxx
To unsubscribe from this list, visit https://www.eclipse.org/mailman/listinfo/sumo-user
sumo-user mailing list
sumo-user@xxxxxxxxxxx
To unsubscribe from this list, visit https://www.eclipse.org/mailman/listinfo/sumo-user