[
Date Prev][
Date Next][
Thread Prev][
Thread Next][
Date Index][
Thread Index]
[
List Home]
|
Re: [sumo-user] Need help with graphs
|
Dear Jakob
Apologies to bother you again.
As per your suggestions, I generated the attached graphs using the below commands:
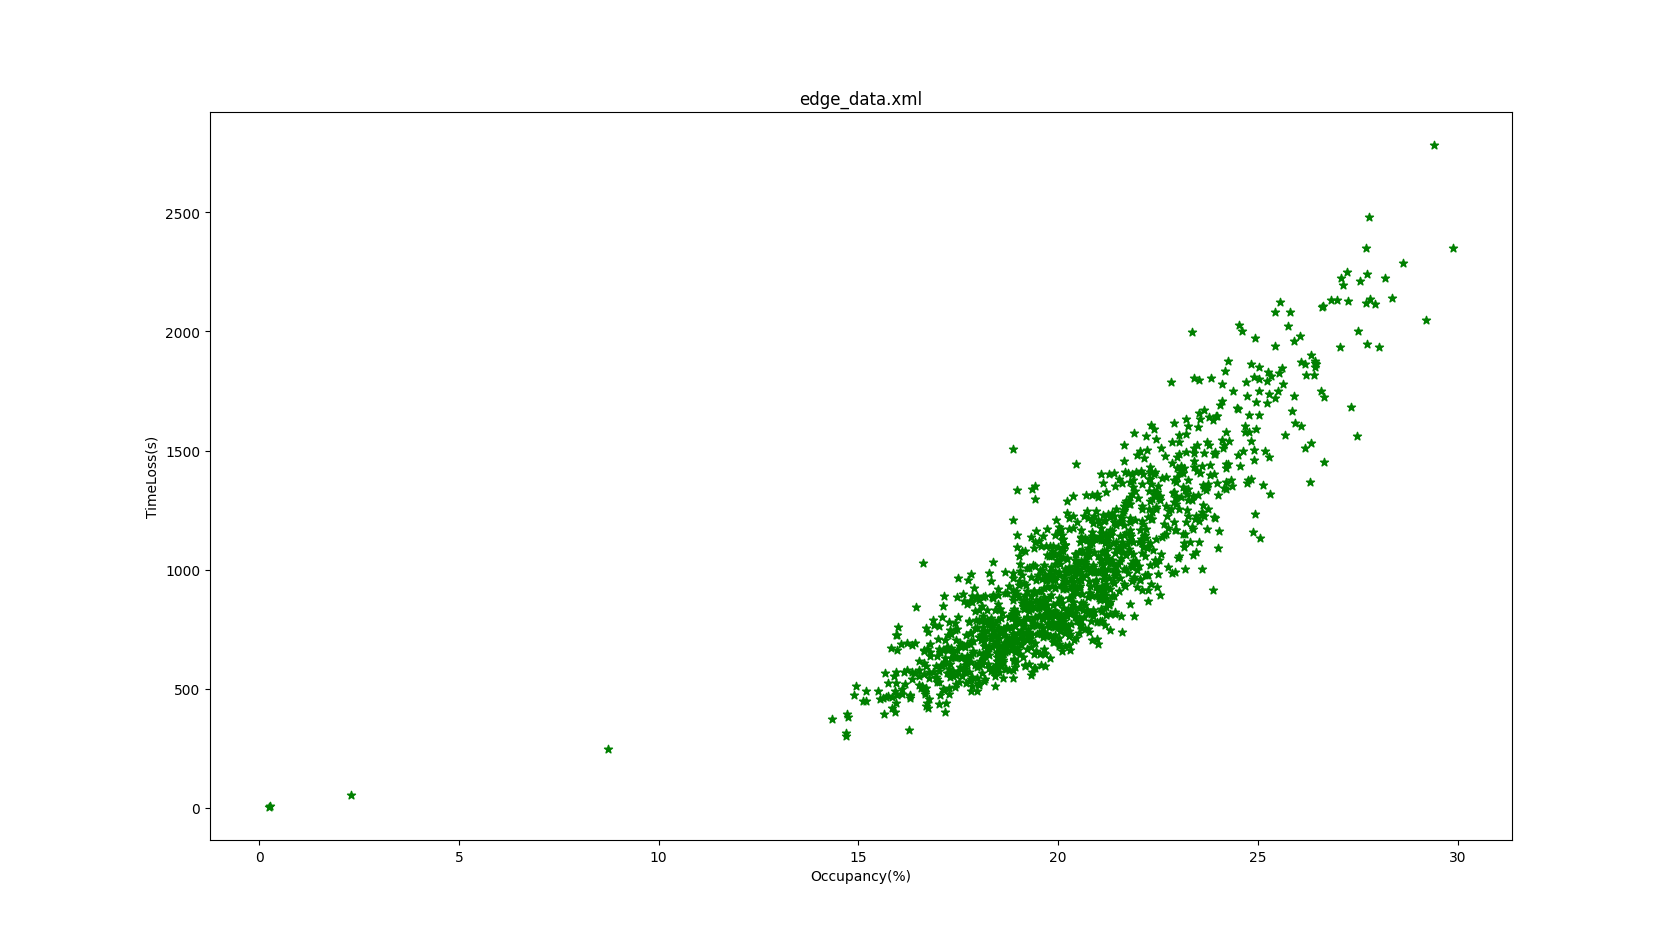
1) Occupancy vs Time Loss -- plotXMLAttributes.py edge_data.xml -i id -x occupancy -y timeLoss -s --scatterplot --xlabel Occupancy(%) --ylabel TimeLoss(s)
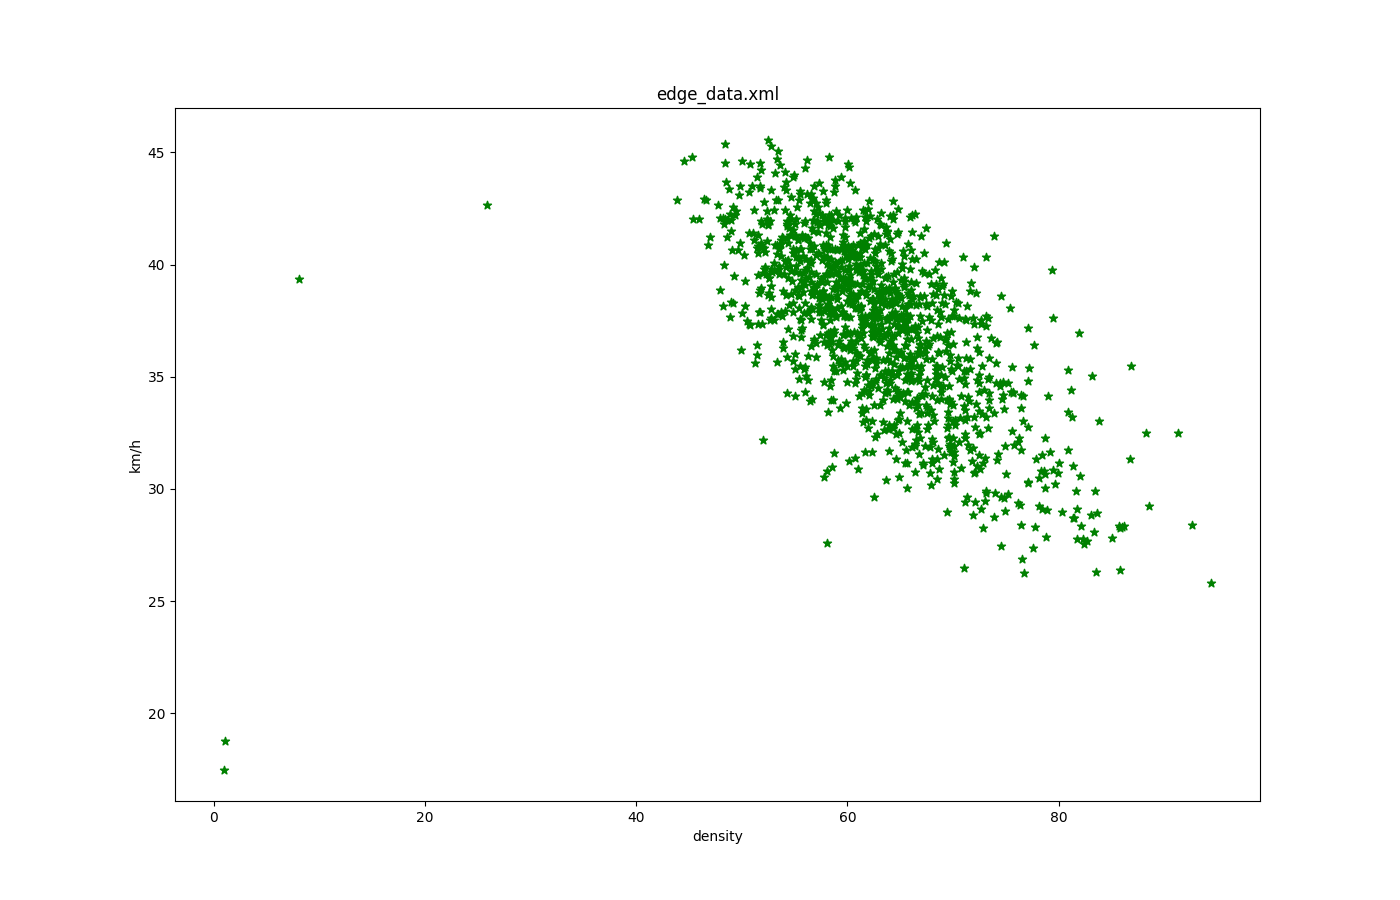
2) Density vs Speed -- plotXMLAttributes.py edge_data.xml -i id -x density -y speed --yfactor 3.6 -s --scatterplot --xlabel density --ylabel km/h"
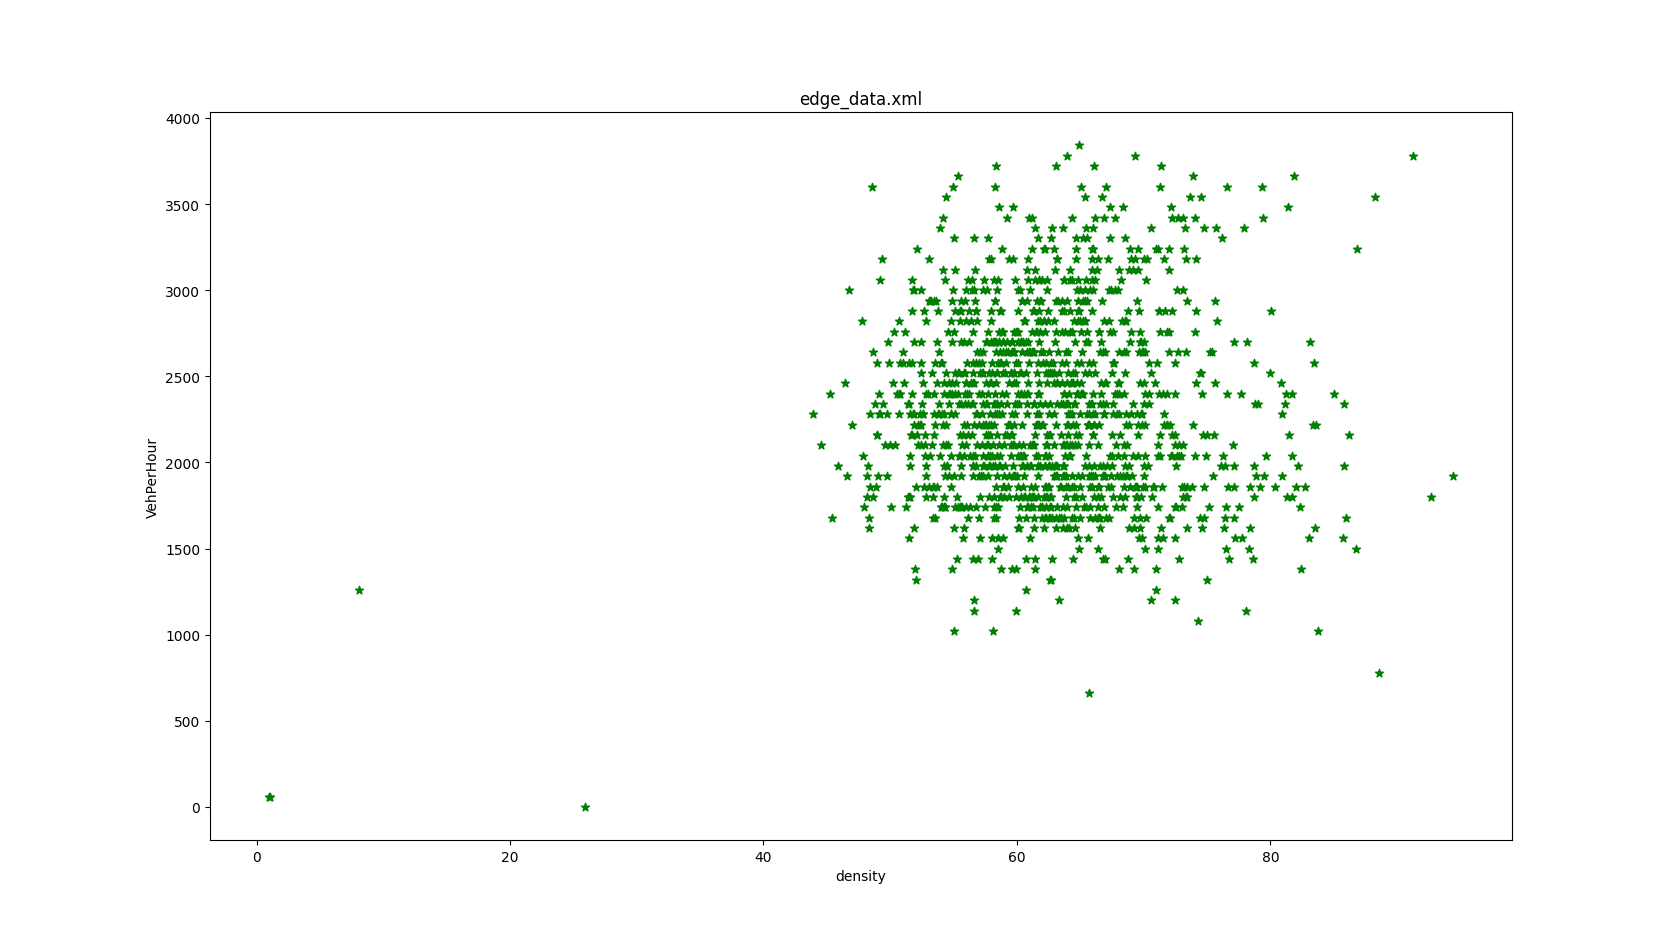
3) Density vs Arrived -- plotXMLAttributes.py edge_data.xml -i id -x density -y arrived --yfactor 60 -s --scatterplot --xlabel density --ylabel VehPerHour
I would be grateful if could clear the following confusions:
1. Why no data is plotted on the left side of all graphs.
2. In Graph_2: why the speed is high even though the density is high ... should not the speed be slow when the density is high? If we have high density, the vehicles will move slowly.
3. In Graph_3: similarly if the density is high then the number of Vehperhour leaving the edge should be less but in the attached graph it is opposite.
Please find the attached configuration files and graphs
Please guide me where I am making mistakes.
Thank you
In case that the edge in question is not a transit edge but the destination edge, use 'arrived' instead of 'left'.
Thank you very much for your reply.
I generated the edge data with <edgeData id="dump_60" freq="60" file="edge_data.xml" excludeEmpty="true"/>.
But the output of the edge data shows left vehicles "0" for each time step.
<interval begin="0.00" end="60.00" id="dump_15">
<edge id="E1" sampledSeconds="1422.00" traveltime="80.92" overlapTraveltime="81.36"
density="23.70" laneDensity="11.85" occupancy="6.38" waitingTime="0.00" timeLoss="140.73"
speed="12.36" speedRelative="0.89" departed="48" arrived="0" entered="0" left="0" laneChangedFrom="6" laneChangedTo="6"/>
</interval>
Please find the attached configuration files.
Thank you
1. you cannot do this with fcd-output directly since you need an intermediate processing step to compute average speeds (fcd has no aggregation). You could plot edgeData 'speed' vs 'left' for this
2. as above. You need to program your own aggregation for this.
3. edgeData 'left' vs 'density'
Dear All
I'm struggling to plot some graphs from the attached files.
I would be thankful if you could share the script/commands to generate the graphs:
1. How can I plot a graph of average speed versus vehicles per hour using FCD output.
2. How to plot a graph of the average leader gap versus vehicles per hour using FCD output.
3. How to calculate the number of vehicles per time that pass through a given point and plot them versus density?
Thank you in advance.
sumo-user mailing list
sumo-user@xxxxxxxxxxx
To unsubscribe from this list, visit https://www.eclipse.org/mailman/listinfo/sumo-user
sumo-user mailing list
sumo-user@xxxxxxxxxxx
To unsubscribe from this list, visit https://www.eclipse.org/mailman/listinfo/sumo-user
sumo-user mailing list
sumo-user@xxxxxxxxxxx
To unsubscribe from this list, visit https://www.eclipse.org/mailman/listinfo/sumo-user
sumo-user mailing list
sumo-user@xxxxxxxxxxx
To unsubscribe from this list, visit https://www.eclipse.org/mailman/listinfo/sumo-user
Attachment:
Graph_2.png
Description: PNG image
Attachment:
Graph_3.png
Description: PNG image
Attachment:
Graph_1.png
Description: PNG image
<routes>

<vType id="type1" vClass="bus" minGap="1" maxSpeed="13" color="red" speedFactor="1.2" speedDev="0.3"/>
<vType id="type2" maxSpeed="16.67" minGap="1" vClass="passenger" color="green" speedFactor="1.2" speedDev="0.3"/>

<flow id="f" type="type1"  vehsPerHour="10000" from="E1" to="E1" departLane="best" departSpeed="avg" begin="0" end="3600" />
<flow id="f1" type="type2" vehsPerHour="40000" from="E1" to="E1" departLane="best" departSpeed="avg" begin="0" end="3600"/>

</routes>
Attachment:
a.sumocfg
Description: Binary data
<additional xmlns:xsi="http://www.w3.org/2001/XMLSchema-instance"; xsi:noNamespaceSchemaLocation="http://sumo.dlr.de/xsd/additional_file.xsd";>

	<edgeData id="dump_15" freq="60" file="edge_data.xml" excludeEmpty="true"/>

</additional>
<?xml version="1.0" encoding="UTF-8"?>

<!-- generated on 2022-02-18 21:47:02 by Eclipse SUMO netedit Version 1.12.0
<configuration xmlns:xsi="http://www.w3.org/2001/XMLSchema-instance"; xsi:noNamespaceSchemaLocation="http://sumo.dlr.de/xsd/netconvertConfiguration.xsd";>

    <input>
        <sumo-net-file value="D:\SUMO%20Experiments\Traffic%20Flow\network.net.net.xml"/>
    </input>

    <output>
        <output-file value="D:\SUMO%20Experiments\Traffic%20Flow\network.net.net.xml"/>
    </output>

    <processing>
        <geometry.min-radius.fix.railways value="false"/>
        <geometry.max-grade.fix value="false"/>
        <offset.disable-normalization value="true"/>
        <lefthand value="false"/>
    </processing>

    <junctions>
        <no-internal-links value="true"/>
        <no-turnarounds value="true"/>
        <junctions.corner-detail value="5"/>
        <junctions.limit-turn-speed value="5.5"/>
        <rectangular-lane-cut value="false"/>
    </junctions>

    <pedestrian>
        <walkingareas value="false"/>
    </pedestrian>

    <report>
        <aggregate-warnings value="5"/>
    </report>

</configuration>
-->

<net version="1.9" junctionCornerDetail="5" limitTurnSpeed="5.50" xmlns:xsi="http://www.w3.org/2001/XMLSchema-instance"; xsi:noNamespaceSchemaLocation="http://sumo.dlr.de/xsd/net_file.xsd";>

    <location netOffset="0.00,0.00" convBoundary="-500.00,100.00,600.00,100.00" origBoundary="-10000000000.00,-10000000000.00,10000000000.00,10000000000.00" projParameter="!"/>

    <edge id="E1" from="J0" to="J1" priority="-1" length="1000.00">
        <lane id="E1_0" index="0" speed="13.89" length="1000.00" shape="-500.00,95.20 600.00,95.20"/>
        <lane id="E1_1" index="1" speed="13.89" length="1000.00" shape="-500.00,98.40 600.00,98.40"/>
    </edge>

    <junction id="J0" type="dead_end" x="-500.00" y="100.00" incLanes="" intLanes="" shape="-500.00,100.00 -500.00,93.60"/>
    <junction id="J1" type="dead_end" x="600.00" y="100.00" incLanes="E1_0 E1_1" intLanes="" shape="600.00,93.60 600.00,100.00"/>

</net>