[
Date Prev][
Date Next][
Thread Prev][
Thread Next][
Date Index][
Thread Index]
[
List Home]
|
Re: [science-iwg] Publication Quality Plotting
|
Hi Jake,
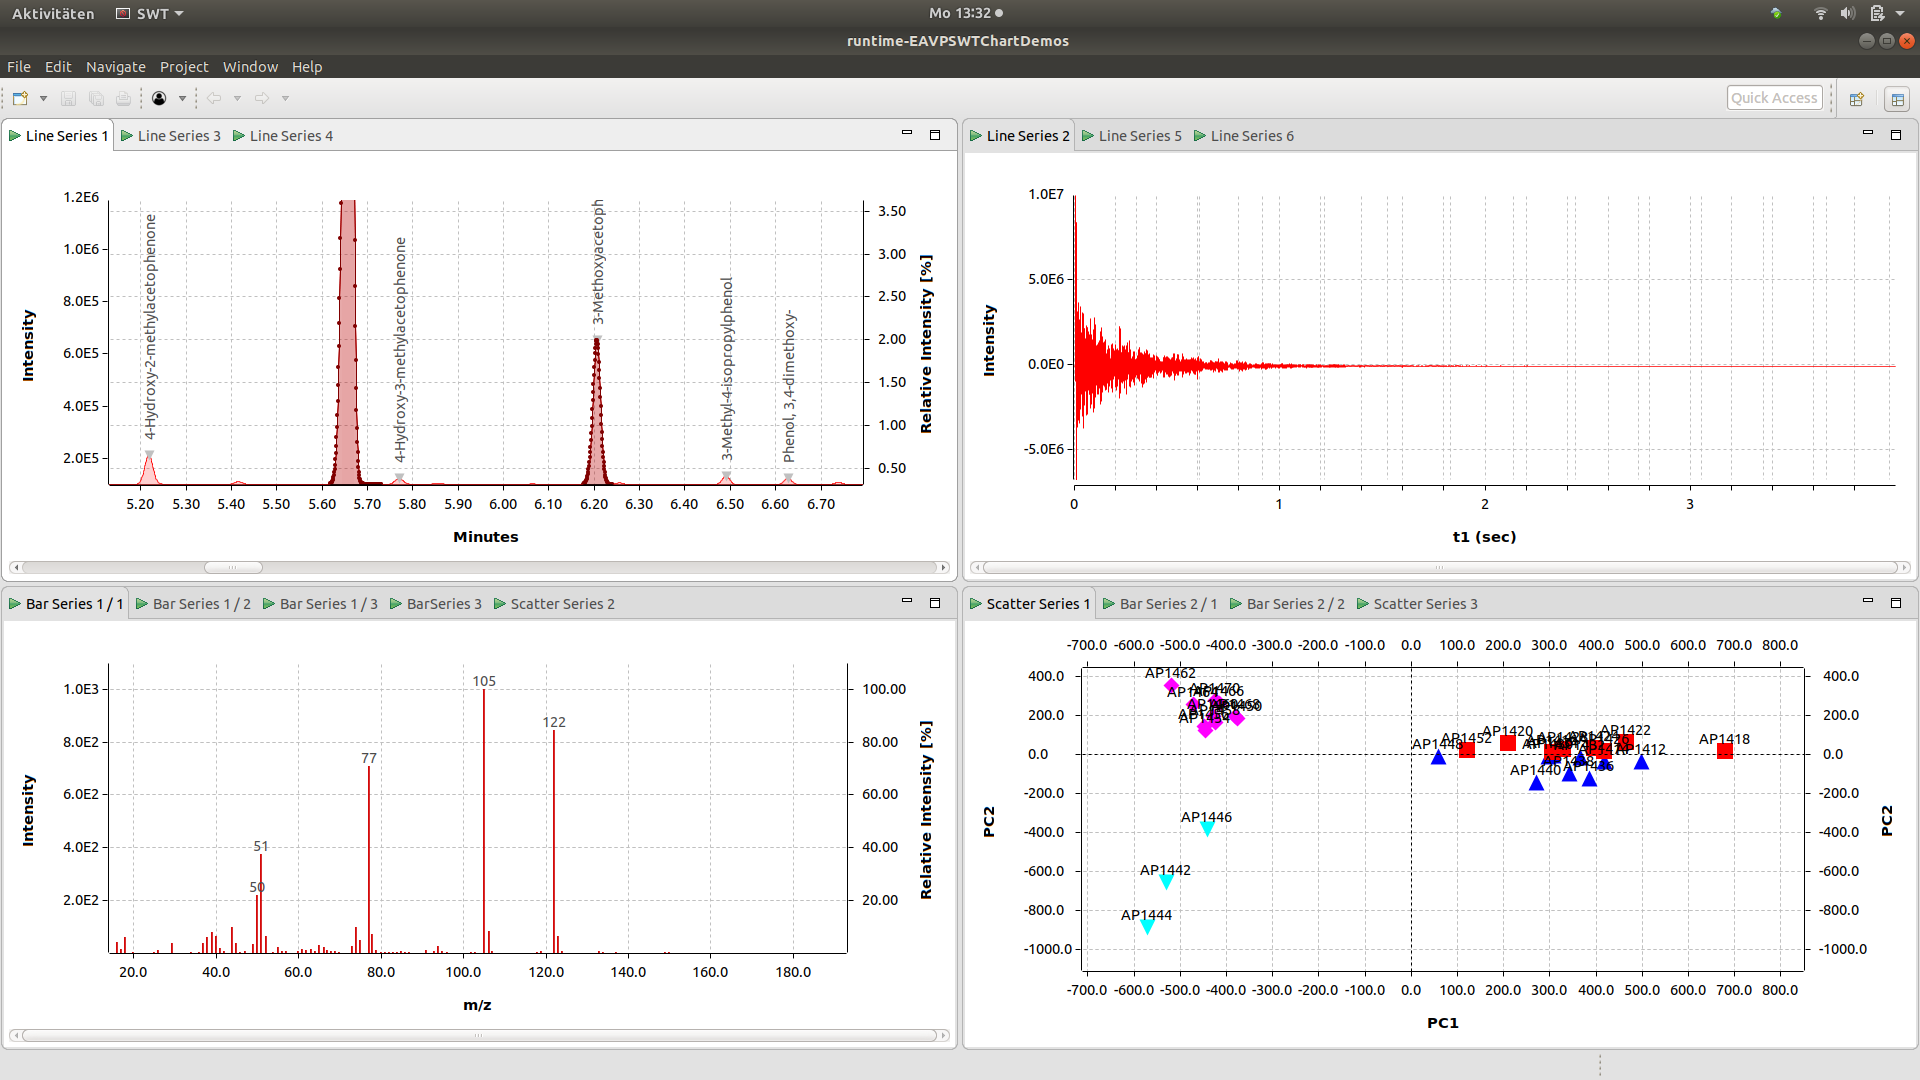
you could use the SWTChart extensions for that:
https://github.com/eclipse/eavp/blob/chemclipse/org.eclipse.eavp.service.swtchart/Build.txt
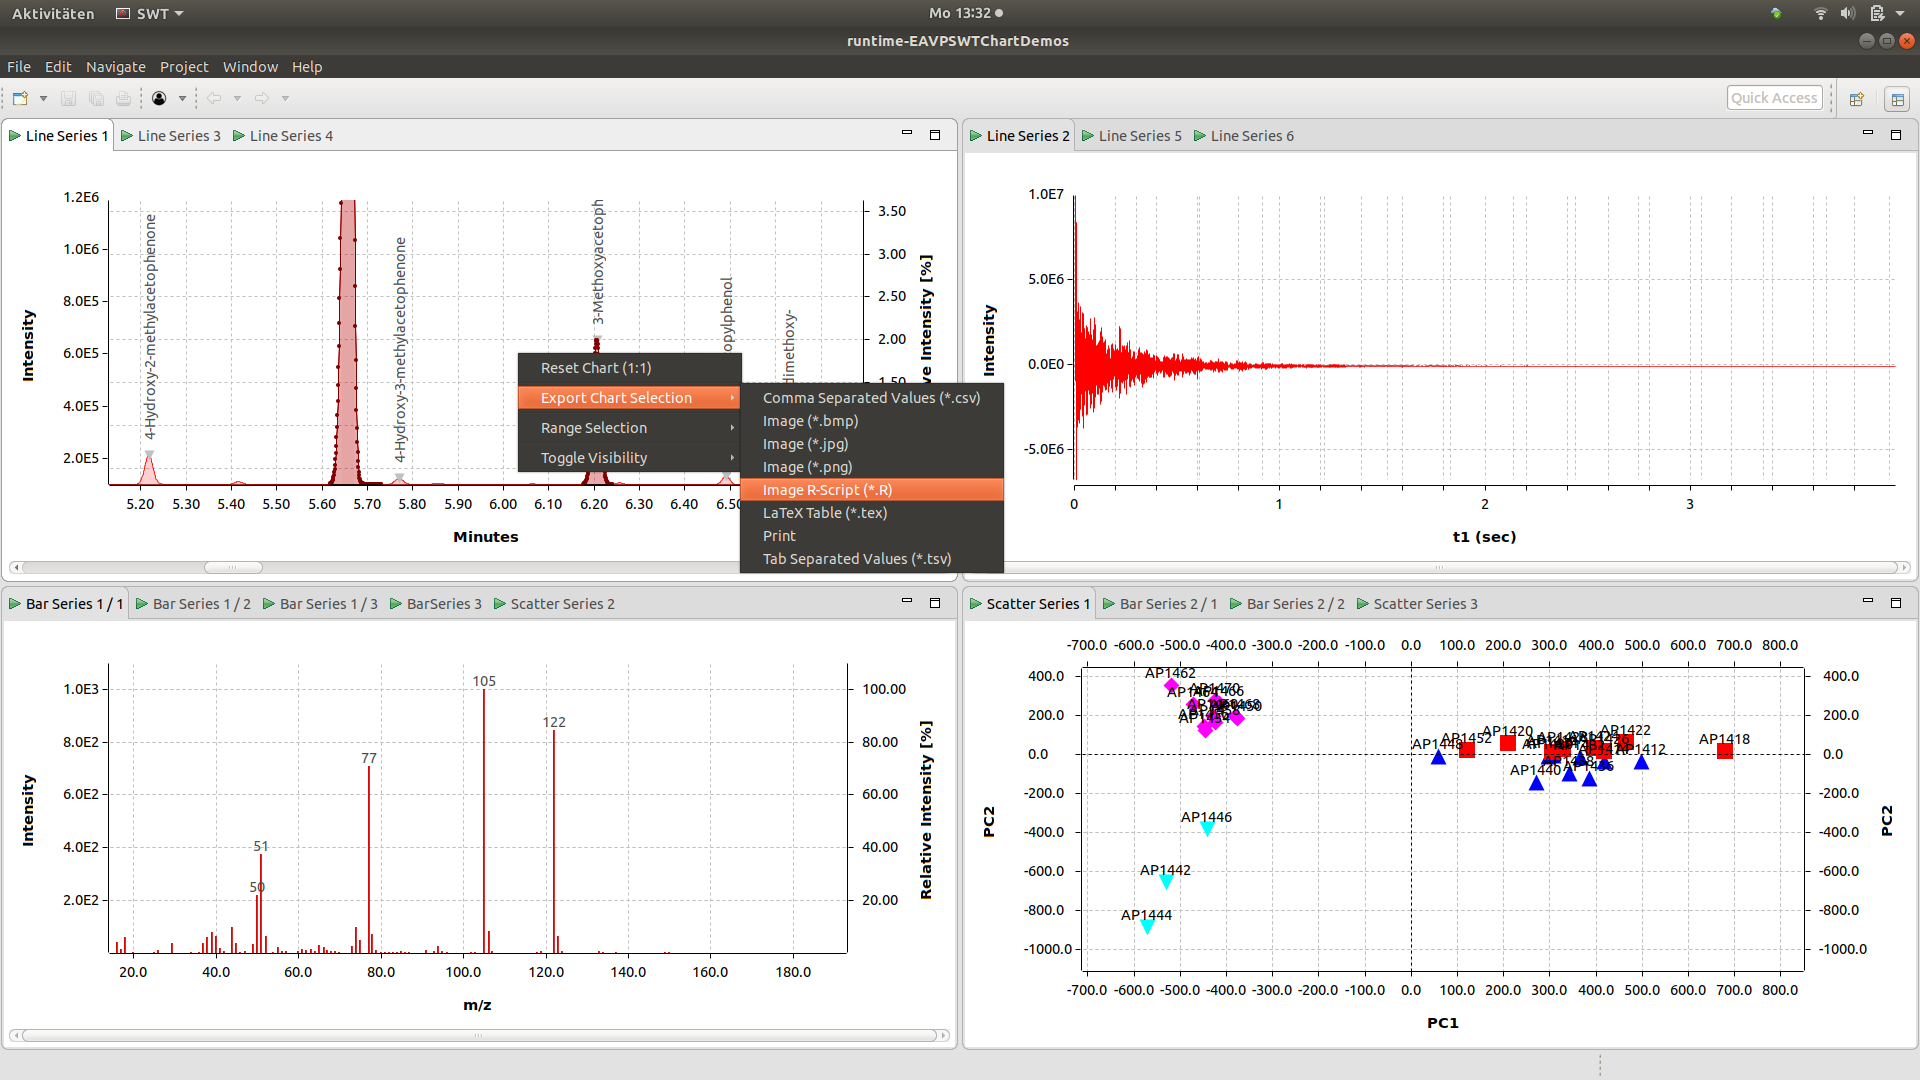
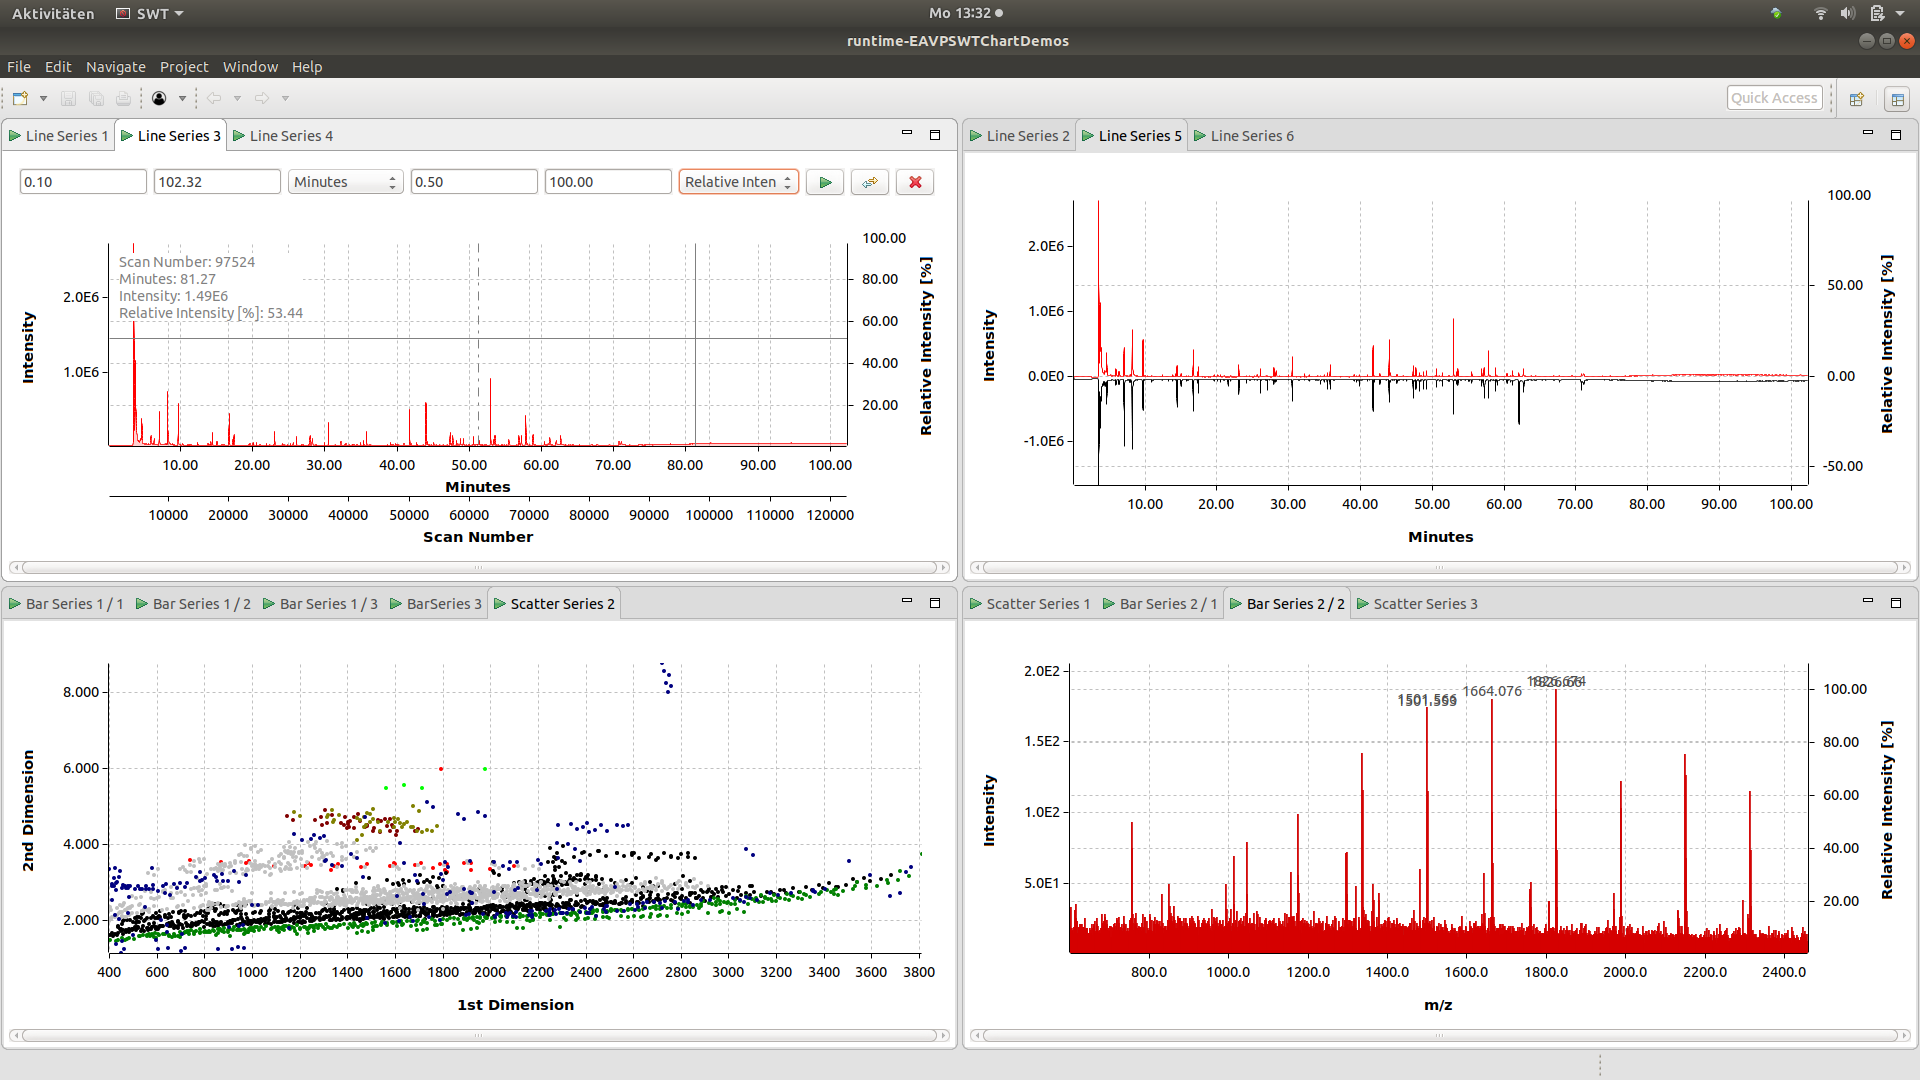
See attached some screenshots. It's possible to add new export
option. The library is generic, so the export converters are
applicable on all the data which can be displayed with the SWTChart
extension. Menu extension can be added via code or via an extension
point:
org.eclipse.eavp.service.swtchart.demos.parts.LineSeries_3_Part
/*
* Add menu items.
*/
chartSettings.addMenuEntry(new ZoomInHandler());
chartSettings.addMenuEntry(new ZoomOutHandler());
//
applySettings(chartSettings);
org.eclipse.eavp.service.swtchart.demos.plugin.xml
<extension
point="org.eclipse.eavp.service.swtchart.menuitems">
<MenuItemSupplier
MenuEntry="org.eclipse.eavp.service.swtchart.demos.menu.ResetXAxisHandler">
</MenuItemSupplier>
<MenuItemSupplier
MenuEntry="org.eclipse.eavp.service.swtchart.demos.menu.ResetYAxisHandler">
</MenuItemSupplier>
</extension>
At the moment, export to *.png, ... as well as to an R script is
supported. To match your needs, we could add new SVG, EPS, ...
export converter here:
org.eclipse.eavp.service.swtchart.menu.export
In this case, we have to options:
A) Do a generic implementation to export the data to *.svg format.
This would be the easiest one.
B) Use VectorGraphics2d [1]. This extension needs to be installed
separately as it LGPL based.
Let's chat the next days.
Best,
Philip
[1] http://trac.erichseifert.de/vectorgraphics2d/
Dear Science Working Group,
Sorry to bother you again, but your advice
on jzy3d was excellent, and we again have a question that you
might be able to help with.
Our users keep asking for publication
quality plotting (2d rather than 3d this time). Now to me this
means SVG/PDF/EPS, at the full resolution of the data.
We currently use the Nebula XYGraph, and
have an export to SVG (I think using some old Graphiti code to
bridge to the SVGGraphics2D in batik), but it is rubbish. I
think this is because XYGraph’s line trace downsamples the
data, so that it doesn’t draw to the same pixel twice, but
also because the trace directly uses the draw2D graphics
drawLine to draw directly to the screen in pixel co-ordinates,
not to the co-ordinate frame of the graph. This gives us an
SVG that looks little better than a bitmap (see attached
screenshot from inkscape, inset shows what zoomed in data
should look like).
I know many people on here use SWTChart,
does anyone know if this is likely to suffer the same issue?
Does anyone have any other suggestions of a swt-compatible
plotting library that might better support SVG export?
Kind regards,
Jake
Dr
Jacob Filik
Senior
Software Scientist
Tel:
+441235 77 8690
Diamond
Light Source Ltd.
Diamond
House
Harwell
Science & Innovation Campus
Didcot
Oxfordshire
OX11
0DE
--
This e-mail and any attachments may contain
confidential, copyright and or privileged material, and are for
the use of the intended addressee only. If you are not the
intended addressee or an authorised recipient of the addressee
please notify us of receipt by returning the e-mail and do not
use, copy, retain, distribute or disclose the information in or
attached to the e-mail.
Any opinions expressed within this e-mail are those of the
individual and not necessarily of Diamond Light Source Ltd.
Diamond Light Source Ltd. cannot guarantee that this e-mail or
any attachments are free from viruses and we cannot accept
liability for any damage which you may sustain as a result of
software viruses which may be transmitted in or with the
message.
Diamond Light Source Limited (company no. 4375679). Registered
in England and Wales with its registered office at Diamond
House, Harwell Science and Innovation Campus, Didcot,
Oxfordshire, OX11 0DE, United Kingdom
_______________________________________________
science-iwg mailing list
science-iwg@xxxxxxxxxxx
To change your delivery options, retrieve your password, or unsubscribe from this list, visit
https://dev.eclipse.org/mailman/listinfo/science-iwg
--
~~~~~~~~~~~~~~~~~~~~~~~~
OpenChrom - the open source alternative for chromatography / mass spectrometry
Dr. Philip Wenig » Founder » philip.wenig@xxxxxxxxxxxxx » http://www.openchrom.net
~~~~~~~~~~~~~~~~~~~~~~~~
|
Attachment:
Bildschirmfoto von »2017-11-27 13-32-08«.png
Description: PNG image
Attachment:
Bildschirmfoto von »2017-11-27 13-32-19«.png
Description: PNG image
Attachment:
Bildschirmfoto von »2017-11-27 13-32-57«.png
Description: PNG image