Hi Marc; Thanks for the quick response. Please see my comments inline.
@All; While on this thread, are there any scalability studies performed for Mosquitto server? Please share.
regards
Siva
From: hono-dev-bounces@xxxxxxxxxxx [mailto:hono-dev-bounces@xxxxxxxxxxx]
On Behalf Of Pellmann Marc (INST/ECS4)
Sent: Tuesday, September 05, 2017 8:38 PM
To: hono developer discussions
Subject: Re: [hono-dev] [Hono-Scalability]: Hono-Jmeter plugin testing challenges
Hi Siva,
1 and 2)
The test should run and the receiver should receive all sender messages (at least if you give him more time). This should be true, if you selected the “Wait for credits” in
the sender (as it is in the default) test case? If they would be discarded by Hono it would be visible in Grafana. Are there errors in the JMeter logs?
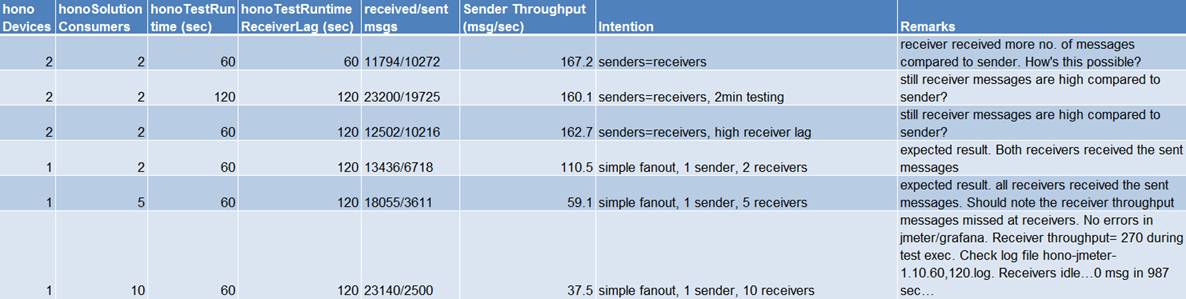
[Siva]: I’ve allocated double the amount of time for receiver compared to the sender as you can observe from the tests (row 4,5 in table below mail chain). During
the time; when the sender is finished the job and only receiver thread is alive, observed the following log messges – meaning receiver is not busy and still unable to capture the telemetry. “Wait for credits” in the sender is enabled in all the tests. There
were no errors in Jmeter log.
Jmeter log:
INFO o.e.h.j.c.HonoReceiver: Receiver Thread Group 1-1: received batch of 0 messages in 1037 milliseconds
INFO o.e.h.j.c.HonoReceiver: Receiver Thread Group 1-1: received batch of 0 messages in 987 milliseconds
………..
………..
………..
INFO o.e.h.j.c.HonoReceiver: Receiver Thread Group 1-1: received batch of 0 messages in 1017 milliseconds
INFO o.e.h.j.c.HonoReceiver: Receiver Thread Group 1-1: received batch of 0 messages in 1014 milliseconds
Is there any empirical formula that one can come up with for the receiver? Something like
receiver life time = no. of senders * test execution time + lag
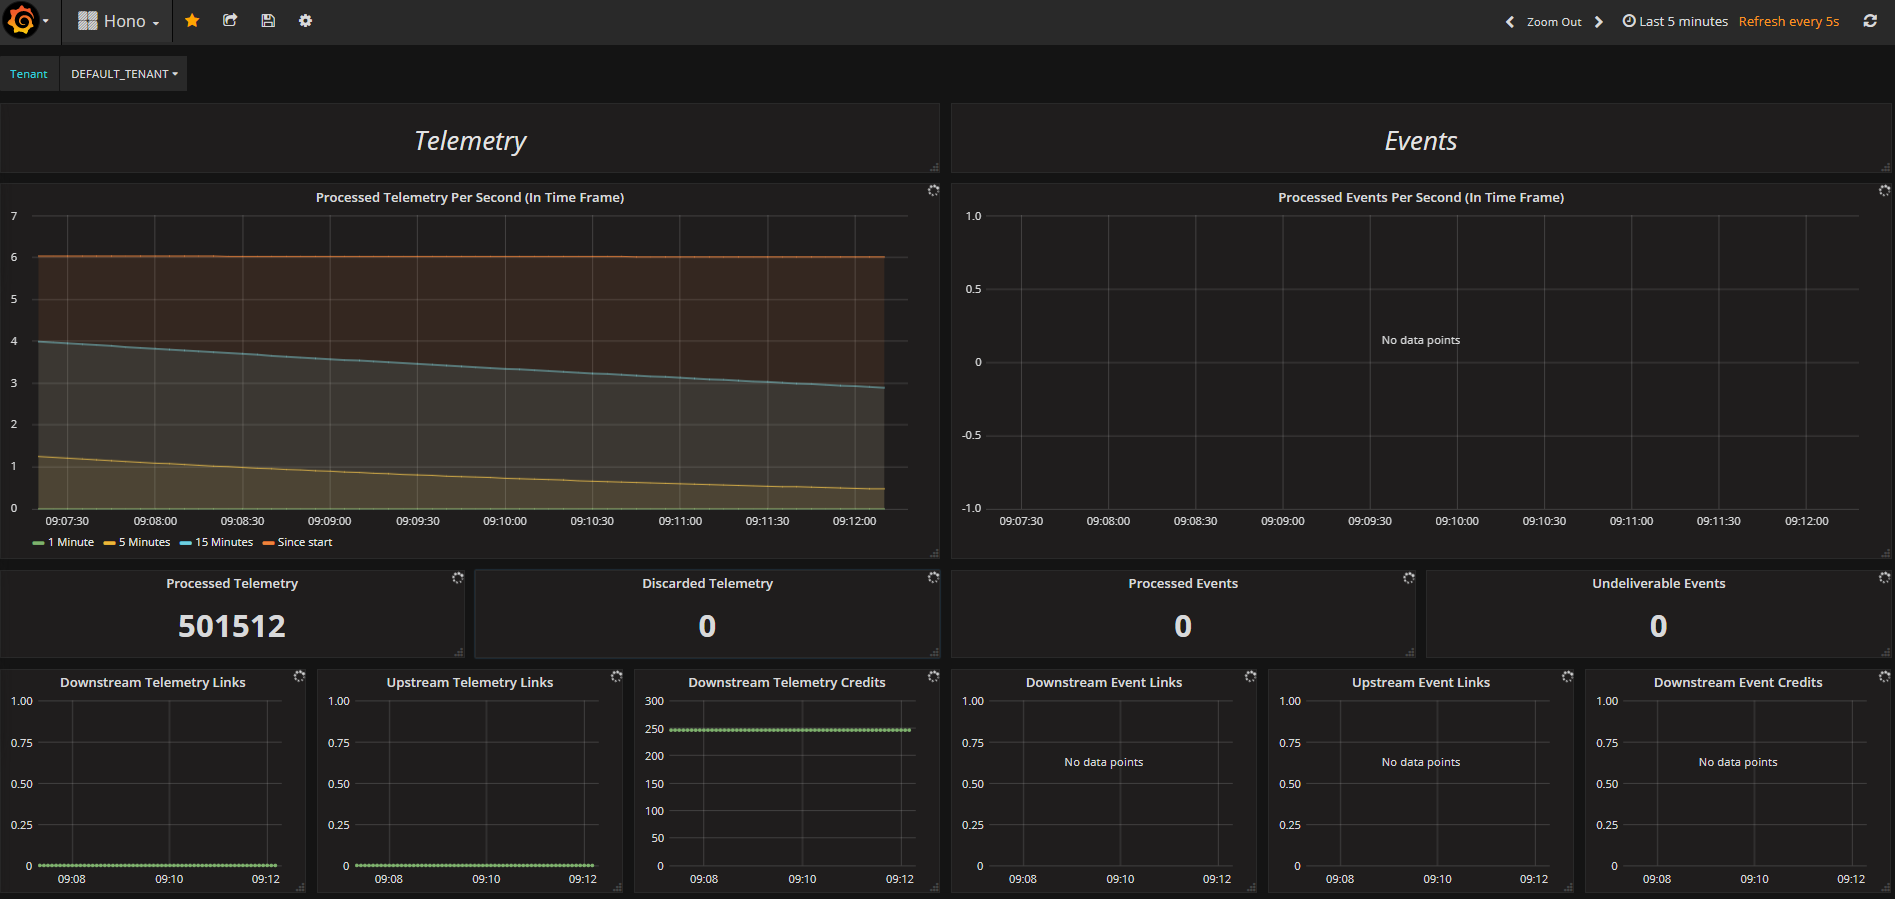
PFA grafana screenshot, discarded messages widget not showing any dropped message count. Where can I find same?
3)
I do not really understand what you mean here? What do want to archive?
[Siva]: If there is a provision for the user to control “how many messages to send in a batch” (alias MAX_MESSAGES_PER_BATCH_SEND) at what rate/frequency
from the sender sampler in JMeter, then user can expect total no of messages that a sender will send in the test execution time. AFAIK, batch sending frequency is not controlled in the present plugin? HTH.
From your response from 4), I will create an issue for this provision.
4)
The idea to send (max) 300 messages in one JMeter sample is because with sending only one message, there is a lot of time in the sample management of JMeter. I agree that it
would be nice to configure this (maybe you could create an issue?) But this 300 has nothing to do with the initial 250 link capacity. This 250 credits are given initially from the dispatch router intermediary. The following capacity exchange is done with own
frames after they are under a certain limit. But the message flow and credit handling is complex and I would need to dive deeper in it to be sure.
[Siva]: I understand.
The handling with number of devices from the test is not necessarily exactly the same if you compare it with an adapter. The test opens a connection and a link for each thread
(=sender, =device). At e.g. our adapters all devices would be handled over the same connection. But I do not think this will end in very different numbers, for the moment.
[Siva]: Okay. Here’s my understanding, correct me if I’m wrong – essentially hono-adapter will have 250 credits irrespective of no. of senders/devices.
So, to enhance device throughput capability – user will have the following options with the current state of hono.
a) user have to run multiple instances of Adapter and point batch of devices to different adapters
b) increase the credit count.
In our default configuration the dispatch router is configured to multiplex/fanout to all consumers. In this configuration all consumers need to get the message – so I would
expect the the dispatch router to be the bottle neck if you have more consumers.
For the telemetry test it might be also a good idea to reconfigure the router to balance to the receivers (and use more of them) – if not, the single receiver might always
be the bottle neck.
[Siva]:
I’m using the default configuration for the dispatch router.
I’m not sure what you mean by “fanout scenario -
dispatch router to be the bottle neck if you have more consumers” and “telemetry scenario
- single receiver might always be the bottle neck”.
Please explain.
Further test cases below;
Mit freundlichen Grüßen / Best regards
Marc Pellmann
Bosch Software Innovations GmbH
INST/ECS4
Schöneberger Ufer 89-91
10785 Berlin
GERMANY
marc.pellmann@xxxxxxxxxxxx
Registered office: Berlin, Register court: Amtsgericht Charlottenburg, HRB 148411 B
Executives: Dr. Ing. Rainer Kallenbach, Michael Hahn
Hi; I’m trying to perform hono scalability studies using hono-jmeter plugin.
I would like to simulate the following situations for better understanding of the Hono scalability
·
Latency test: Generate a constant throughput and measure the latency, CPU and RAM usage
·
Telemetry test: Generate a constant throughput with multiple hono senders and a single receiver - measure the CPU & RAM usage
·
Fan-out test: Multiple hono consumers are consuming incoming telemetry from a single sender – measure the CPU & RAM usage
I have started exploring the provided hono-jmeter testcase i.e.,
hono_jmeter_runtime.jmx. I’m able to execute the testcase successfully with 1 hono sender and 1 hono receiver by configuring with respective ports and certificates. I understand that sender is waiting till the receiver is available and sending a batch
of 300 messages (hardcoded in the source code) at one go and the message sending continues till the test execution time (honoTestRuntime) is over.
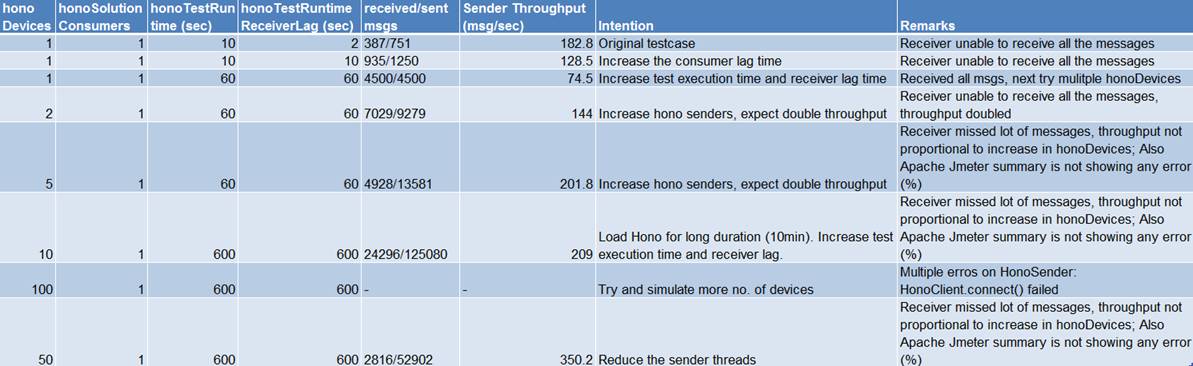
In an attempt to create the constant throughput for longer durations (minimum 10min), I have carried out the below tests with different input parameters.
In this regards, I have the following questions
1.
How to create constant throughput? In principle, it should be proportional to the no. of hono devices (when talking about sender throughput). But, I have not observed the same.
2.
Although receiver is started before the sender, why is receiver unable to receive the messages (even with increased receiver lag time)? How to capture these metrics? Neither
the Jmeter Summary report nor the Grafana UI displaying the missing messages.
3.
It would be nice if there is a provision to define the periodicity for the messages to be sent.
4.
I observed that there’s a credit of 250 messages per telemetry link. Whereas the default sender is sending batch of 300 messages, to avoid the confusion I tweaked the MAX_MESSAGES_PER_BATCH_SEND
value from 300 to 250. Also, I assume this limit of 250 credits will limit the honoDevice sending rate to be below 250 messages/sec i.e., max throughput per telemetry link is 250. Is this number 250 defined based on design?
Appreciate your inputs on this issue.
Best
Siva
Registered Office: 130 Pandurang Budhkar Marg, Worli, Mumbai – 400018; Corporate Identity number: L28920MH1957PLC010839; Tel.: +91 (22) 3967 7000; Fax: +91 22 3967 7500;
Contact / Email: www.siemens.co.in/contact; Website:
www.siemens.co.in. Sales Offices: Ahmedabad, Bengaluru, Bhopal, Bhubaneswar, Chandigarh, Chennai, Coimbatore, Gurgaon, Hyderabad, Jaipur, Jamshedpur, Kharghar, Kolkata, Lucknow, Kochi, Mumbai, Nagpur, Navi Mumbai, New
Delhi,