[Date Prev][Date Next][Thread Prev][Thread Next][Date Index][Thread Index] [List Home]
Re: [geowave-dev] GSOC 2015-GeoWave Monitor: Map-Based Accumulo Status and Health

Hi all,

I made quick Documentation about the Project scope, requirement and implementation. Any one interested can find the Documentation from this link[1].
please note that Document is not finalised yet. But you can access the updated Document via the same link in the future.
Also project related Blog post not yet initiated and when i done i will update the thread with the locations to find it out. 

Also any feedback and comments are highly appreciated.

[1] https://docs.google.com/document/d/1V0YJ326V8buMNrAWCxtbCb066fgL70NeFc26UQCQ7bE/edit?usp=sharing

Thanks and Regards.


Rukshan Chathuranga.
Department Of Computer Science & Engineering,
Faculty Of Engineering,
University Of Moratuwa. Sri Lanka.

On Mon, Aug 17, 2015 at 9:43 PM, Rukshan Chathuranga <rcrukshan17@xxxxxxxxx> wrote:
Hi Whitney,

This is what i could achieved so far. please find the attachment for the current application screenshot.
  • Recently i added feature to work with namespaces
  • Implemented REST api for namespace operations
  • Application is work as expected and providing expected features.
  • Has integrated with Geowave webapp module
  • Also extended existing REST API for accumulo statistics
I am planing to take next few days to improve, bug fixing and wrap-up code. Also i hope to write some blog post and project report.
I am very happy to have some feedback and any comments regarding the projects. Any feedbacks are highly appreciated and value to me.

Code can be available on my repo [1] 
Statistic related code available at here [2]
Web application available at here [3]
REST API implementation is available at here [4]


Thanks and Regards.


Rukshan Chathuranga.
Department Of Computer Science & Engineering,
Faculty Of Engineering,
University Of Moratuwa. Sri Lanka.

On Sat, Aug 15, 2015 at 9:44 PM, Whitney O'Meara <james.w.omeara@xxxxxxxxx> wrote:

Good work Rukshan. It looks great so far.

On Aug 15, 2015 10:09 AM, "Rukshan Chathuranga" <rcrukshan17@xxxxxxxxx> wrote:
Hi Whitney,

i was work on thing that you pointed out. 
  • Replace with World Map
  • implement data visualisation on hovered popup menu
  • Bug fixes
  • Data formatting
Also still i am working on application integration with Geowave. And need to apply more style to the application.
I have attached the current working application screenshot. any comment and feedbacks are highly appreciated.

Thanks and Regards.


Rukshan Chathuranga.
Department Of Computer Science & Engineering,
Faculty Of Engineering,
University Of Moratuwa. Sri Lanka.

On Thu, Aug 13, 2015 at 12:42 AM, Whitney O'Meara <james.w.omeara@xxxxxxxxx> wrote:
I'll try to check this out tonight.  From the looks of it, everything seems pretty good.  We definitely want valid values to be reported though.  Also, we really want to be able to see more than just a map of the US, as GeoWave data could be indexed anywhere.  Also, yes, I agree that your webapp should be part of the main GeoWave project, and not a side project.  That should give you some things to run down while I check out your work.  If I don't get to it tonight, I will try to get to it tomorrow.  Things are very busy at the moment on my end.

- Whitney

On Tue, Aug 11, 2015 at 10:41 AM, Rukshan Chathuranga <rcrukshan17@xxxxxxxxx> wrote:
​Hi Whitney,

Can you please review and provide the feedback about the webapp i develop.
Also i have concern about how to deploy the web app. Currently it is separate application and should we include it inside the Geowave webapp?

Thanks and Regards.


Rukshan Chathuranga.
Department Of Computer Science & Engineering,
Faculty Of Engineering,
University Of Moratuwa. Sri Lanka.

On Tue, Aug 4, 2015 at 8:20 PM, Rukshan Chathuranga <rcrukshan17@xxxxxxxxx> wrote:
​Hi Whitney,

Did you had the chance to review my implmentation?

Thanks and Regards.


Rukshan Chathuranga.
Department Of Computer Science & Engineering,
Faculty Of Engineering,
University Of Moratuwa. Sri Lanka.

On Sat, Aug 1, 2015 at 8:58 PM, Rukshan Chathuranga <rcrukshan17@xxxxxxxxx> wrote:
​Hi Whitney,

i moved to "Task 3 ­ Develop a robust GeoWave Monitor UI" since i finished the computing Convex Hull for each tablet.
Also i implemented the Test case for it as you said. code can be found at here[1]


Here the REST api, I implemented.

  • http://<host>/app/stat/table/
    • will give  the all the table stat in that accumulo instance
  • http://<host>/app/stat/tablet/{table}
    • Will give all the tablet stat associated with table you provided
  • http://<host>/app/stat/tablet/{table}/{tabletId}
    • Will give the Stat data for requested tablet and table
  • http://<host>/app/stat/geo
    • Will give the Convex Hull points
    • Still not design the final API definition
I implemented the web app using D3 for displaying stat information based on the above REST API. Currently it is a prototype but it works as you said. It need some improvement and functionalities. Code will be found at[2]

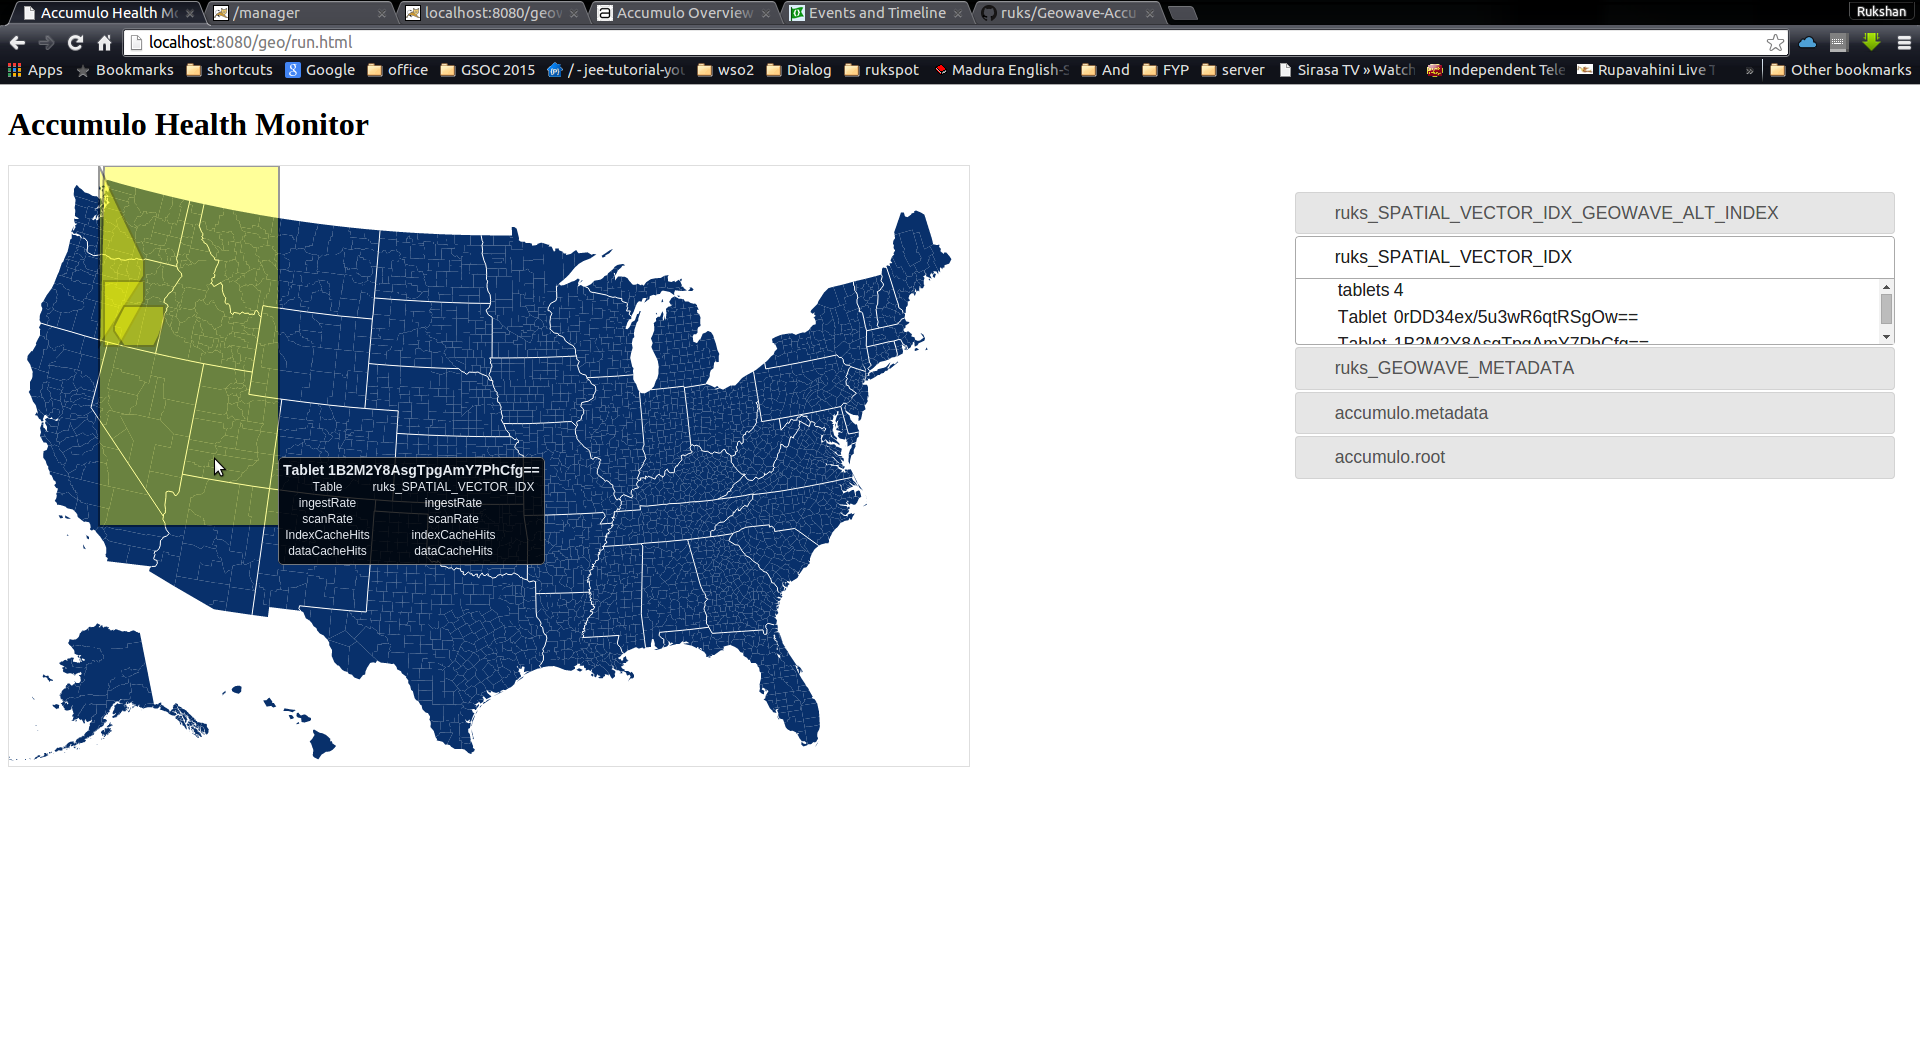
Here the snapshot of the webapp.
  • at right, it list the table list and have list down each tablet associate with it.
  • at left on the map, it shows the list of tablet's convex hull, associate with one table.
  • If you hover the tablet, it will show a tablet using REST api. (here not implemented to show fetched stat)


Can you review the code and provide some feedback regarding the webapp and REST api.


Thanks and Regards.


Rukshan Chathuranga.
Department Of Computer Science & Engineering,
Faculty Of Engineering,
University Of Moratuwa. Sri Lanka.

On Mon, Jul 27, 2015 at 8:26 PM, Rukshan Chathuranga <rcrukshan17@xxxxxxxxx> wrote:
Hi Whitney,

I implemented the code to find a convex hull based on the tablet key ranges. But as you said, it is complex method and time consume we have to use mapreduce. Will you guide me how to do that and further improvement?

And also meanwhile i'll try to improve Unit testing for the implemented codes.

Thanks and Regards,


Rukshan Chathuranga.
Department Of Computer Science & Engineering,
Faculty Of Engineering,
University Of Moratuwa. Sri Lanka.

On Tue, Jul 21, 2015 at 10:11 PM, Whitney O'Meara <james.w.omeara@xxxxxxxxx> wrote:
To move onto the next part, you need to first use the ranges that you calculated to query the *_SPATIAL_VECTOR_IDX table.  This is just going to be a scan of the table using an Accumulo WholeRowIterator.  Each Key/Value pair that you receive can be decoded into a SimpleFeature using the decodeRow method from the AccumuloUtils class in GeoWave.  From the SimpleFeatures, you can extract the default geometry.  Using the default geometry, you can calculate the convex hull using the JTS ConvexHull class. 

Does that make sense?

On Tue, Jul 21, 2015 at 11:55 AM, Rukshan Chathuranga <rcrukshan17@xxxxxxxxx> wrote:
Hi Whitney,

i write a code to extract the range[1] of each tablet and expose Stat as REST service. To move to next part, can you explain me briefly how to generate convex hull using these range?


Thanks and Regards.


Rukshan Chathuranga.
Department Of Computer Science & Engineering,
Faculty Of Engineering,
University Of Moratuwa. Sri Lanka.

On Thu, Jul 16, 2015 at 11:07 PM, Whitney O'Meara <james.w.omeara@xxxxxxxxx> wrote:
So, using the listSplits operation, you get an array of Text objects.  This doesn't give you the full range of each tablet, but it does tell you where they split. 

Once you have the Accumulo Keys corresponding to each of the splits, it should be very easy to create your ranges. 

For starters, scanning the table for the first key is a valid idea, but it concerns me to hear that you had an exception during a scan...  That doesn't sound right. 

The easier way would be to use the Accumulo Range class.  Check out this method, and pay particular attention to the parameter descriptions: http://accumulo.apache.org/1.4/apidocs/org/apache/accumulo/core/data/Range.html#Range%28org.apache.accumulo.core.data.Key,%20org.apache.accumulo.core.data.Key%29

Let me know if that helps!


On Thu, Jul 16, 2015 at 1:12 PM, Rukshan Chathuranga <rcrukshan17@xxxxxxxxx> wrote:
Hi Whitney,

Since listSplit() method give me starting row of tablet, i cannot find row that reside in first tablet. i tried with scanner and get first record to find it's range. but it gave me an exception.  

second part is still bit confuse me. but first i try to get the first tablet range while try to understanding second part. then i let you know.

Thanks and Regards.


Rukshan Chathuranga.
Department Of Computer Science & Engineering,
Faculty Of Engineering,
University Of Moratuwa. Sri Lanka.

On Thu, Jul 16, 2015 at 10:22 PM, Whitney O'Meara <james.w.omeara@xxxxxxxxx> wrote:
First off, you definitely should be able to get the range of the first tablet.  What is the issue there?

Second, What I'm saying is that you should query whatever table you're interested in displaying stats for using the ranges that you have generated.  The query will give you the entries that have been ingested by the user(s) for that tablet.  You can then use the SimpleFeatures that are returned to calculate a bounding area. 

Does that make sense?

On Thu, Jul 16, 2015 at 12:42 PM, Rukshan Chathuranga <rcrukshan17@xxxxxxxxx> wrote:
Hi Whitney,

what do you mean by "query the GeoWave namespace/table" . i write a code to get the range of tablets(but not first tablet). can you please explain this?

Thanks and Regards.


Rukshan Chathuranga.
Department Of Computer Science & Engineering,
Faculty Of Engineering,
University Of Moratuwa. Sri Lanka.

On Fri, Jul 10, 2015 at 10:53 PM, Whitney O'Meara <james.w.omeara@xxxxxxxxx> wrote:
Go ahead and move on to task 2.  I don't want to be a blocker for you. 

I'll try to check your code out sometime this weekend and provide feedback. 

On Fri, Jul 10, 2015 at 12:10 PM, Rukshan Chathuranga <rcrukshan17@xxxxxxxxx> wrote:
Hi Whitney,

I implemented Test cases for Table[1] and Tablet[2] stats. Also i implement rest services[3][4] for them as well. Can you review it and let me know whether can i moved to task 2.


Thanks and Regards.


Rukshan Chathuranga.
Department Of Computer Science & Engineering,
Faculty Of Engineering,
University Of Moratuwa. Sri Lanka.

On Wed, Jul 8, 2015 at 8:55 PM, Whitney O'Meara <james.w.omeara@xxxxxxxxx> wrote:
Look into MiniAccumuloCluster.  You can (and should) use that to setup an accumulo cluster with geowave for unit tests. 

On Wed, Jul 8, 2015 at 11:11 AM, Rukshan Chathuranga <rcrukshan17@xxxxxxxxx> wrote:
Hi Whitney,

i implement two test case for each Tablet[1] and Table[2] Stat classed. Can you review and let me know, what should i improve?

Since Accumulo Statistics are changed with time, it is difficult to define constant values to assert them. Also is there any way to automatically start Geowave with test cases. I used the GeoWaveDemoApp.java, but it seems it does not start as expected.


Thanks and Regards.


Back to the top