Hi,
Unfortunately, fixing the problem you are describing would require more serious changes. The Breakpoints view displays the breakpoints registered with the Eclipse Platform breakpoint manager. When a breakpoint is set in the GDB console, CDT creates a so-called platform breakpoint and registers it with IBreakpointManager which sends notifications to all sessions and to the view. As a result the new breakpoint appears in the view. As you can see, filtering the view is not a solution. BTW, the suggested filtering is already supported, you just need to turn on the “Show Breakpoints Supported By Selected Target” option in the toolbar of the Breakpoints view.
It is possible to differentiate the platform breakpoint created as a result of a console breakpoint from “normal” breakpoints and not apply it to other active sessions. Please, file a Bugzilla request.
Thank you,
Mikhail
From: cdt-dev-bounces@xxxxxxxxxxx [mailto:cdt-dev-bounces@xxxxxxxxxxx] On Behalf Of ???
Sent: Thursday, August 24, 2017 5:58 AM
To: CDT General developers list. <cdt-dev@xxxxxxxxxxx>; cdt-dev-bounces@xxxxxxxxxxx
Subject: [cdt-dev] breakpoint view Windows
Hi Experts,
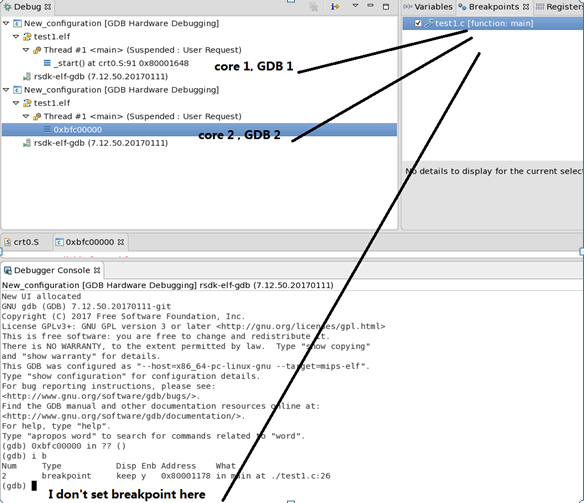
I have an idea, but I don't know whether it's right or not,I found a problem with the breakpoint window:
For embedded system,When debugging multicores, we may use multiple GDBs, and in this case, when you set breakpoint in one of the GDB's console, it will affect another GDB,
so I think the breakpoint window should be like the register window, bound to the specific debug instance(GDB), so that it doesn't interact with each other.
Best regards!
---------------------------------------------
guosheng_gao 高国胜
Realsil Microelectronics Inc.
Tel: +86-512-6258-8966 ext.6617
E-Mail: guosheng_gao@xxxxxxxxxxxxxx
---------------------------------------------