[
Date Prev][
Date Next][
Thread Prev][
Thread Next][
Date Index][
Thread Index]
[
List Home]
|
RE: [cdt-dev] Attach Debugger to a running process
|
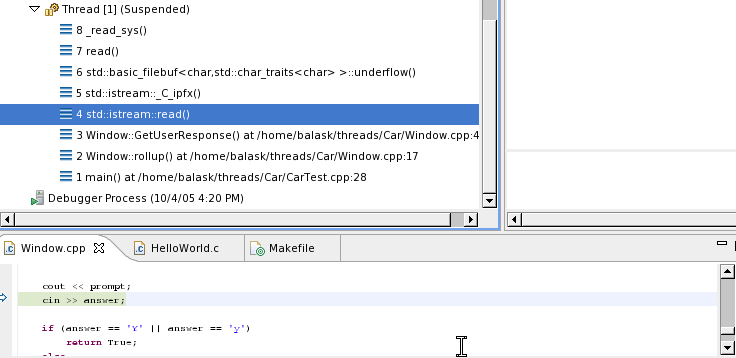
When I attach the debugger to a running process, I see  the first 3 or 4 threads refers to the system calls & then comes our program
as seen in the attached image. Due to this , until I click on  (3) in the attached image, I don't see the source code getting
highlighted in the editor. Is this an expected behaviour?

I am seeing similar behaviour on Windows & SUSE Linux.

Thanks,
Bala


-----Original Message-----
From: cdt-dev-bounces@xxxxxxxxxxx [mailto:cdt-dev-bounces@xxxxxxxxxxx] On Behalf Of Heiko Jansen
Sent: Monday, August 29, 2005 4:58 PM
To: cdt-dev@xxxxxxxxxxx
Subject: Re: [cdt-dev] Attach Debugger to a running process

You didn´t try, did you?

1)  "Run" --> "Debug"
2)  create a new debug config of type "C/C++ Attach to Local Application"
3)  Select Project
4)  Select Binary
5)  Select Debugger
6)  Click "Apply"
7)  Click "Debug"
CDT will present you a list of running processes.
8)  Select the appropriate one
9)  Debug....

Heiko

Am Montag, 29. August 2005 13:02 schrieb "Balasubramaniyan K"
<balask@xxxxxxxxxxxx> [RE: [cdt-dev] Attach Debugger to a running process]:

> I am not sure if we can attach a running process with its pid (process id).
_______________________________________________
cdt-dev mailing list
cdt-dev@xxxxxxxxxxx
https://dev.eclipse.org/mailman/listinfo/cdt-dev
Attachment:
Attaching a running process.bmp
Description: Windows bitmap