Screenshots
|
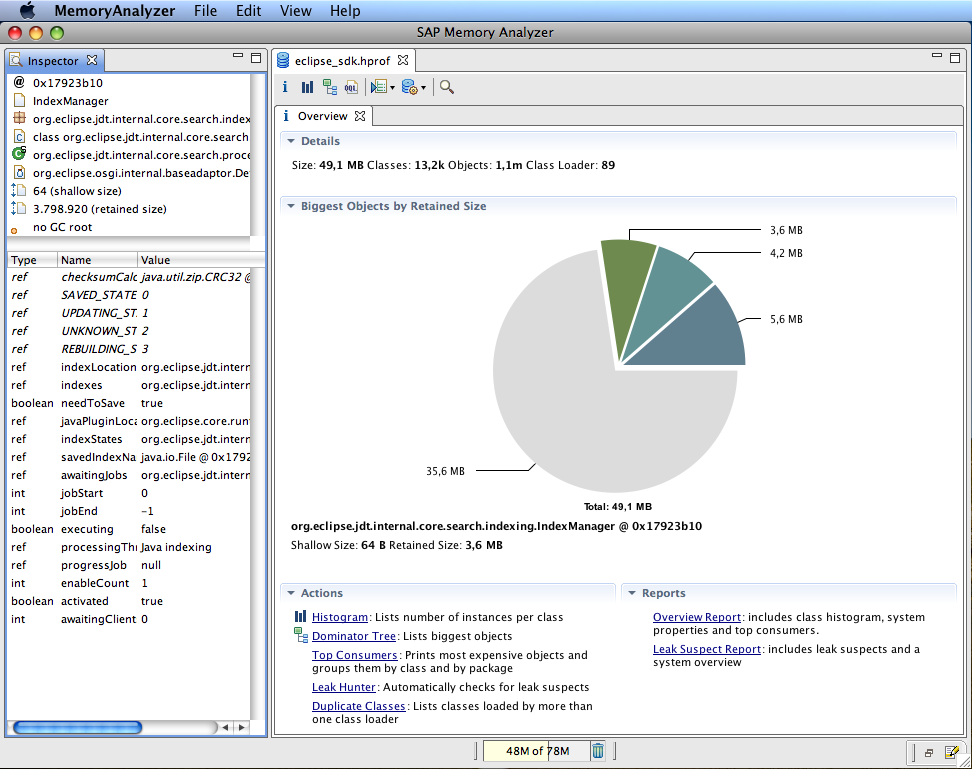
OverviewGet an overview of the heap dump: Size and total number of objects at the top, then a pie chart with the biggest objects and links to continue the analysis. |
|
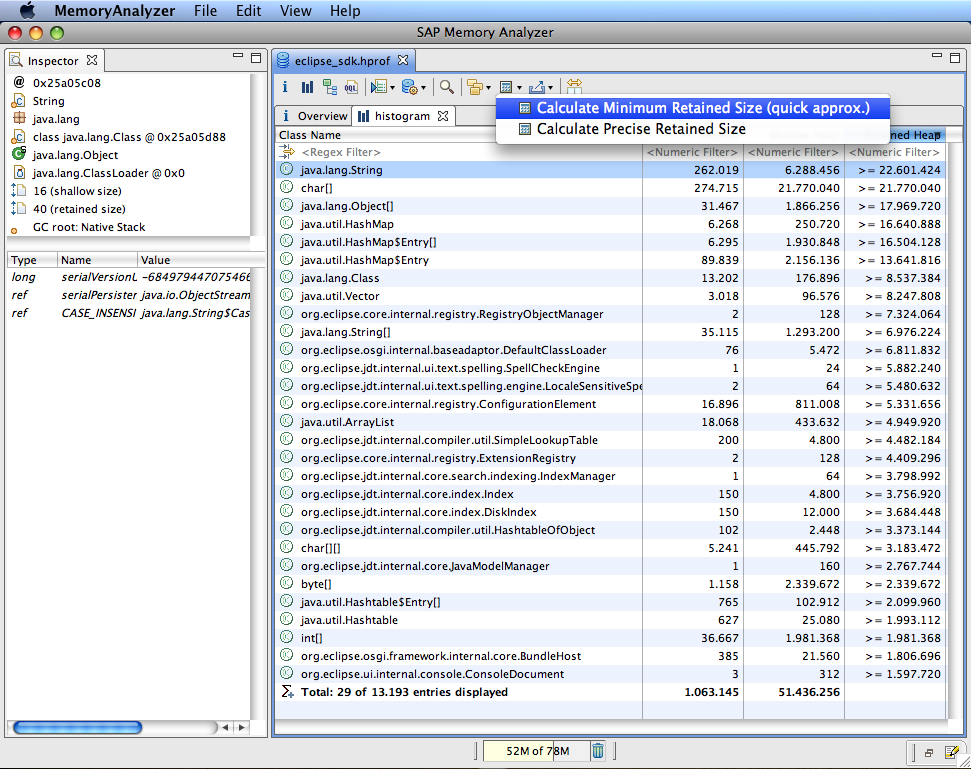
HistogramThe histogram lists the objects grouped by their class. The Memory Analyzer can approximate the retained size very quickly. This is a good indicator where to continue with the analysis. |

|
Dominator TreeThe Dominator Tree lists the biggest objects. One could call it a "Keep-Alive Tree" because the next level shows those objects which are immediately prevented from being garbage collected. Right-click to drill down: view the outgoing and incoming reference or view the path to the GC roots to see the reference chain which keeps the objects alive. |
|
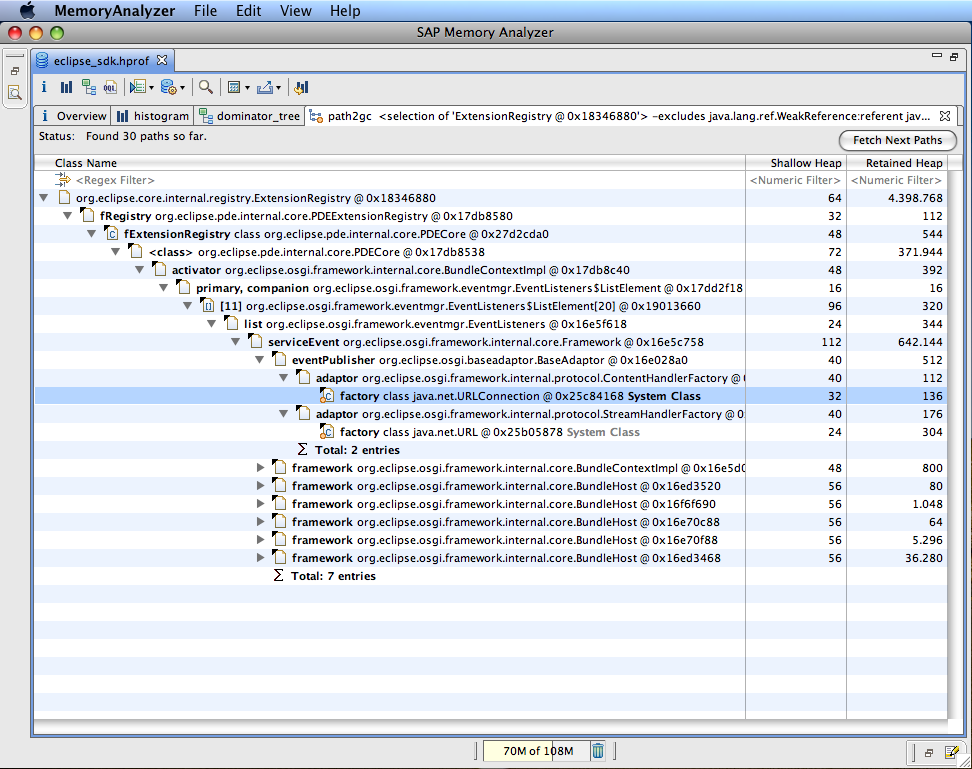
Path to GC RootsThe path to the GC Roots shows the reference chain which prevents that the object is garbage collected. Objects decorated with a yellow dot are Garbage Collection (GC) Roots, i.e. objects which are assumed to be alive. Usually GC Roots are objects that are currently on the call stack of a thread or system classes. |
|
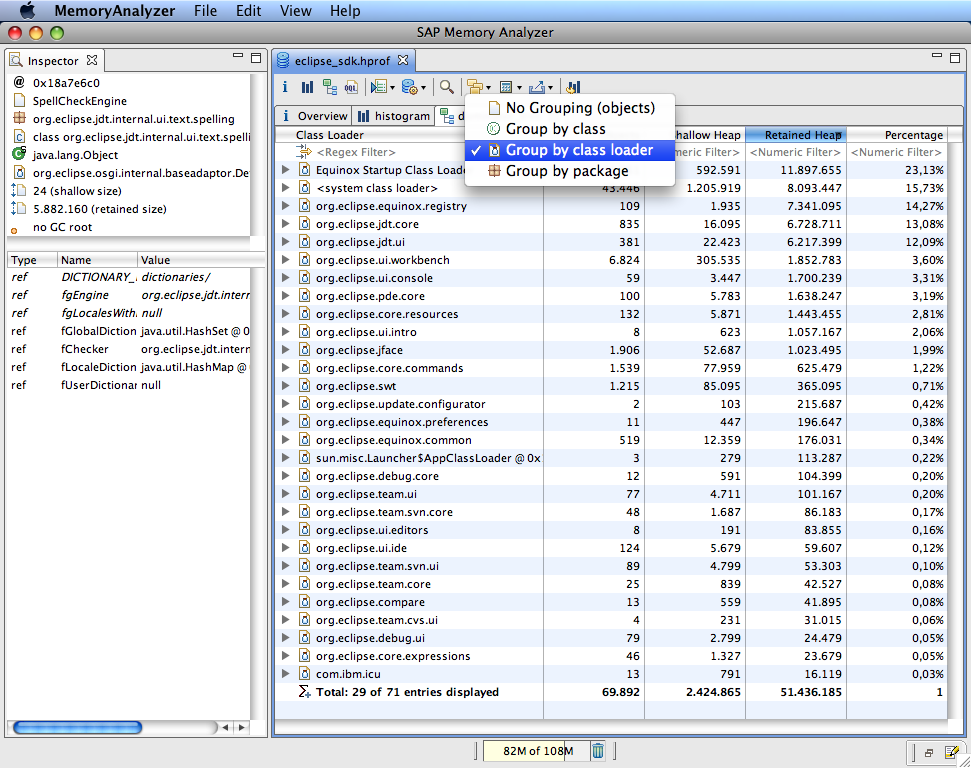
Dominator Tree Grouped by Class LoaderAny decent architectures loads components by different class loaders. Many views of the Memory Analyzer allow you to group the objects by class loader and, hence, easily analyze memory by component. To map the class loader to a meaningful component name (for example the plug-in id), one can plug-in name resolver. |