Hello Guys,
i’m a student working on a trace engine for coordinate measurement machines. I generate my own custom CTF-Trace and I try to visualize it with trace compass.
With the documentation, I managed to create an XY-View which contains some data.
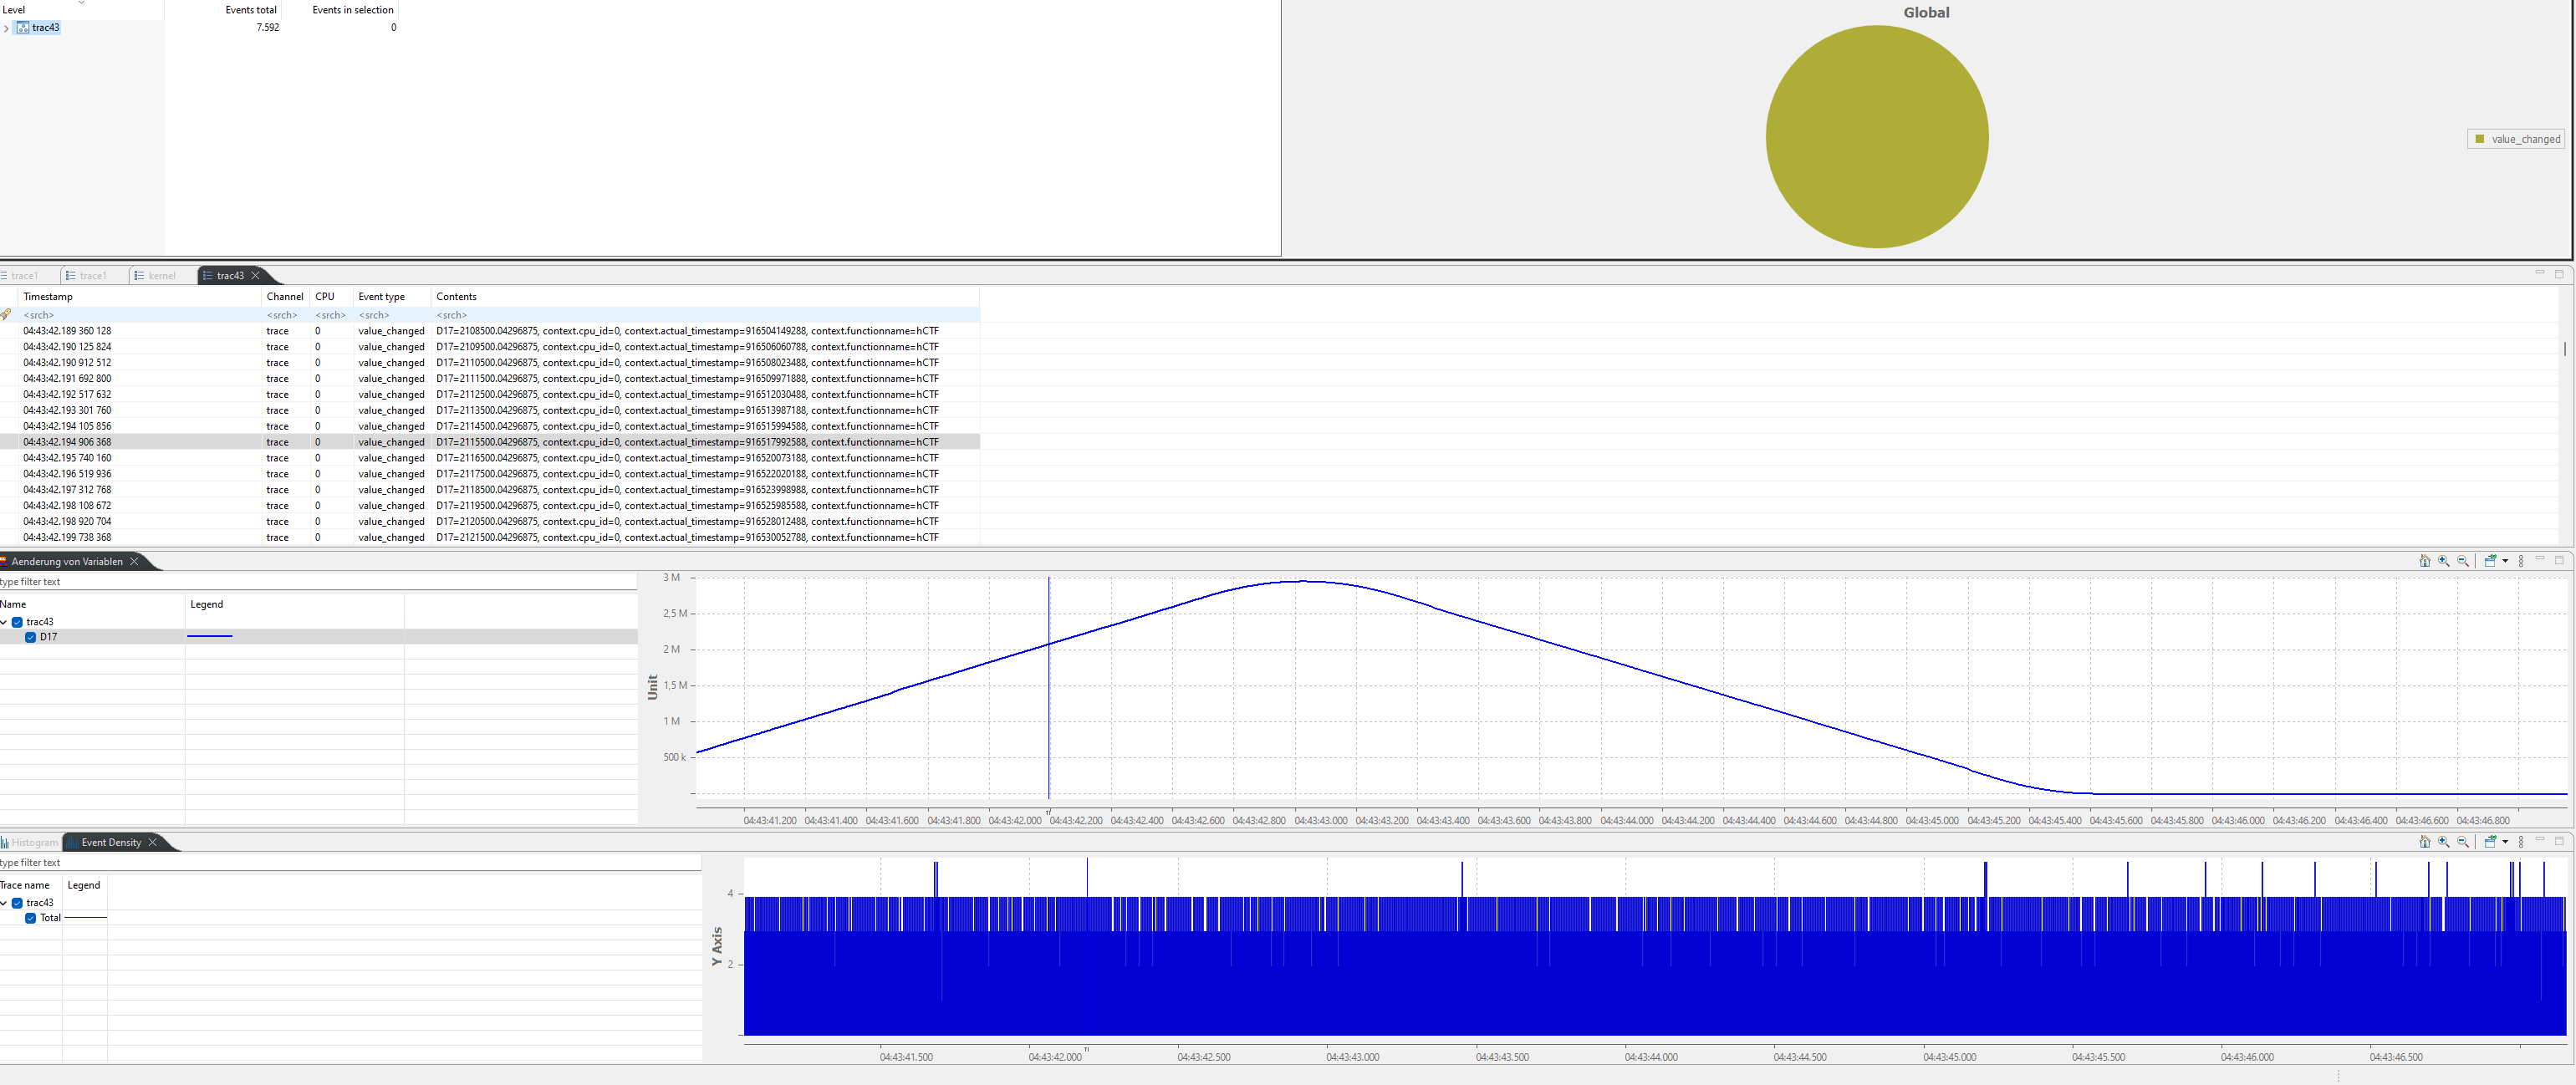
My Problem is that I couldn’t find a way to change the Labels of the Y- and X-Axis. For example, instead of the name “Unit” I’d like to write the actual Unit to
the Axis.
The XML-File looks like this:
<?xml version="1.0" encoding="UTF-8"?>
<tmfxml xmlns:xsi=http://www.w3.org/2001/XMLSchema-instance
xsi:noNamespaceSchemaLocation="xmlDefinition.xsd">
<stateProvider id="test2.ctftrace" version="0">
<head>
<label value="ZTE Views" />
</head>
<eventHandler eventName="value_changed">
<stateChange>
<stateAttribute type="constant" value="Werte" />
<stateAttribute type="constant" value="D17" />
<stateValue type="eventField" value="D17" />
</stateChange>
</eventHandler>
</stateProvider>
<xyView id="test2.ctftrace.view">
<head>
<analysis id="test2.ctftrace"/>
<label value="Aenderung von Variablen"/>
</head>
<entry path="Werte/*">
<display type="self" />
</entry>
</xyView>
</tmfxml>
Is there any way to do this? I’d appreciate some help :)
Kind regards
Aron