We are students from Polytechnique Montreal and we are currently
working on an TraceCompass analysis module for Linux containers
(LXC/Docker/Etc...). The information we track is mostly CPU
usage by pid namespace, which would allow the identification of
CPU-utilization related bottlenecks on a Linux container host.
Currently, it is still a W.I.P. version with test cases coming
soon and hopefully a push to gerrit for code review.
If you guys don't mind, we are asking for quick
advices/recommendations on the W.I.P. analysis.
- What do you guys think about it in general?
- What would be nice to have that is not currently in the
analysis?
- Are we aiming right? If you were managing a Linux
container host (lxc/docker/etc), would this kind of view
help you to identify performance bottlenecks?
We know not everyone have the time to actually apply the patch,
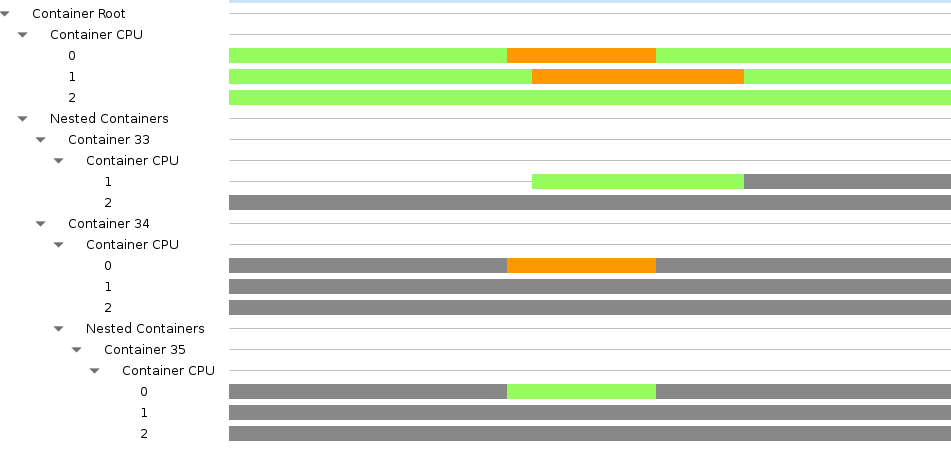
get the traces and run tracecompass, so here's a quick preview
of the analysis :
In green : The CPU time is allocated to the container.
In orange : The CPU time is allocated to a nested container of
that container.
In grey : The CPU time is not allocated to that container.
A lot of you will quickly realize that the container number is
not relevant. It only servers as a "unique container ID". In the
future, we could replace it with the container's hostname.
Also, the view dosen't show which process is currently executed
by the containers. We are currently working on it and this
information IS in the statesystem!!
The patch can be obtained here :
https://github.com/Selora/tracecompass/tree/container
Note : to run the analysis, you need to import "
containerView.xml"
located inside the "
lttng2.kernel.core.analysis.container"
package.
A sample of nested LXC container trace can be ontained here :
https://github.com/Selora/lttng_container_traces
A patch for lttng-modules is required to be able to produce
trace compatible with this analysis :
https://github.com/Selora/lttng-modules
Cheers!
Sebastien & Francis.