Good evening,
The Highway Capacity Manual (HCM) uses the average delay (seconds/vehicle) as the criterion for evaluating the Level of Service at intersections, as shown in the following table.
Although control delay and time loss are theoretically not the same thing, considering that in a traffic microsimulation network, especially in congested networks (in which HCM is limited - see figure below) it is impossible for the delay in a trip to be exclusively due to the intersection control delay, time loss in seconds/vehicle would be a good approximation for the Level of Service of the edge that connects at the intersection.
Density is a good indicator for Level of Service in uninterrupted flows, while for intersections, average delay is more suitable. In urban areas, the relative speed (percentage of the permitted speed) is used, which is already available in the SUMO output.
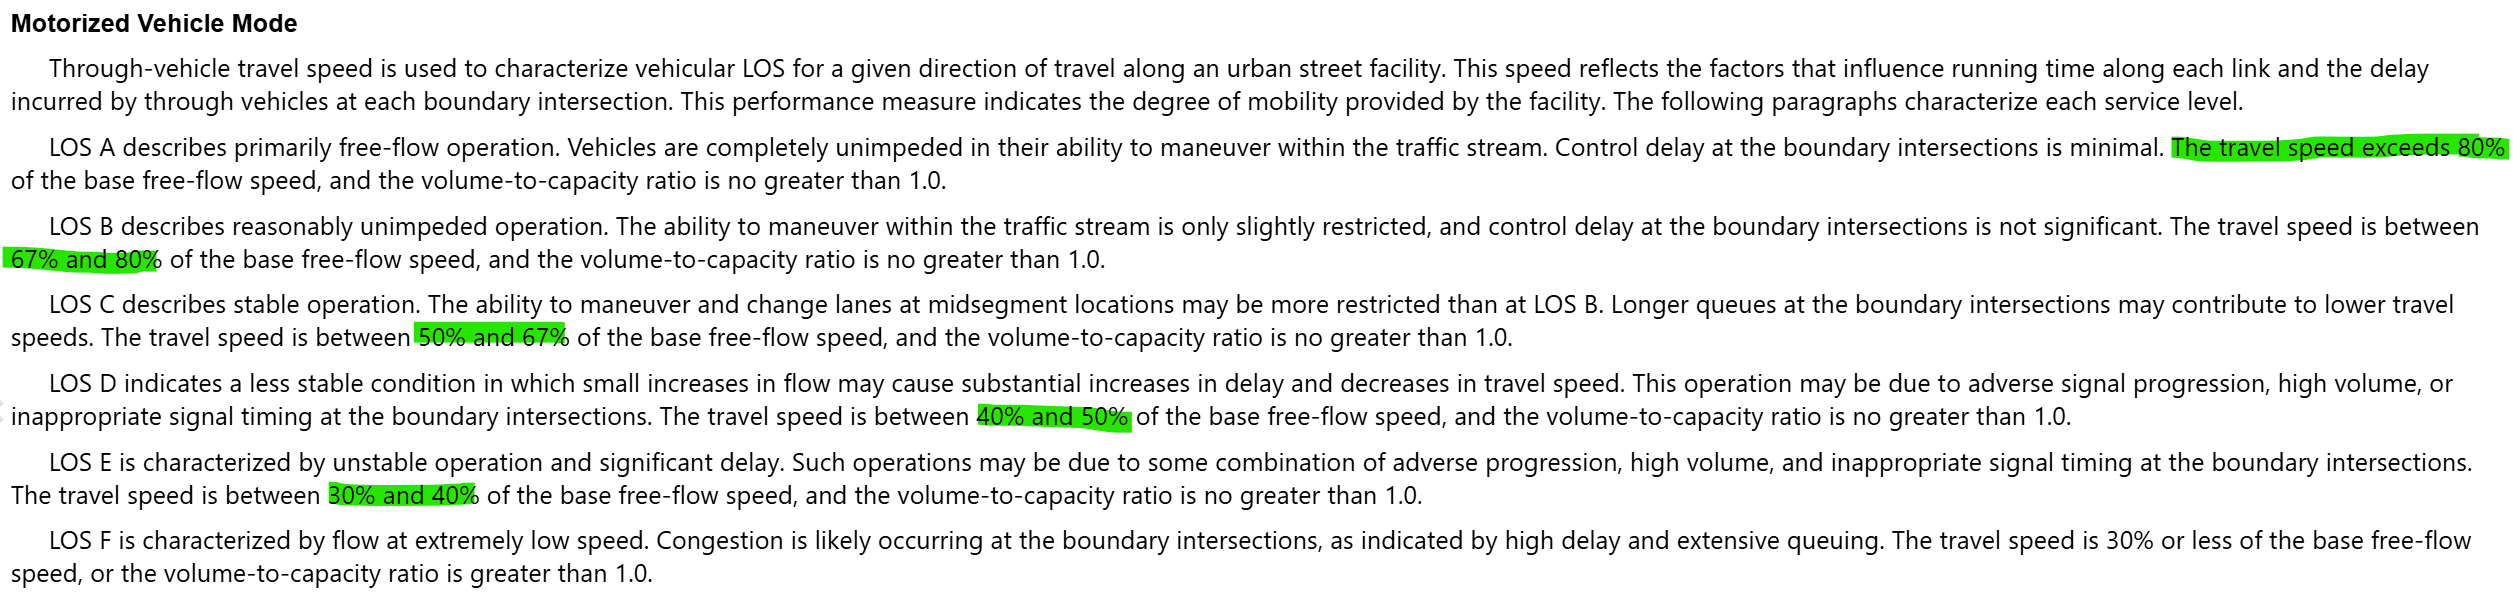
Density is a good indicator for Level of Service in uninterrupted flows, while for intersections, average delay is more suitable. In urban areas, the relative speed (percentage of the permitted speed) is used, which is already available in the SUMO output.
With your help in some past emails, I continued working on the algorithm that calculates flow and timeloss/vehicle. The flow is now standard for edge data; I will update the algorithm to obtain timeloss/vehicle.
The next step I'm working on is obtaining the average timeloss/vehicle of the edges approaching the intersection. I can already do this manually, because by analyzing the NET.xml file I observed that the lanes approaching a junction are called incLanes, so I obtained which edges they would be and subsequently obtained the average for the junction, but it's still very manual. By the way, I would like to know if, in case I obtain an algorithm to perform this procedure, it is possible to make it public to other SUMO users?
Regards,
Pedro Oliveira


