
[Date Prev][Date Next][Thread Prev][Thread Next][Date Index][Thread Index] [List Home]
Re: [sumo-user] (no subject)

1) The only certain way to avoid unwanted routes in routeSampler output is exclude them from the input. The recommended way to obtain input routes is from routing/simulation:
https://sumo.dlr.de/docs/Tools/Turns.html#obtaining_initial_routes
My recommendation would be to use randomTrip route output with option --marouter for obtaining initial routes.

That being said, you could also try to eliminate the worst candidates from findAllRoutes with the help of https://sumo.dlr.de/docs/Tools/Routes.html#implausibleroutespy

2) 
- four counting route usage, you can run routeSampler with option **-u dummy**. The route probability attributes in the route distribution will correspond to their usage count
- for showing route shapes, you can use tools/route/route2poly. Options --blur is useful for spreading routes slightly so they do not overlap and option --scale can be used to scale polygon width by usage (This assumes child-element routes rather than named routes)
- for evaluating an OD pair, you can use tools/countEdgeUsage.py routes.rou.xml  --subpart ORIGIN,DESTINATION --subpart.via -i -o edgedata.xml
  - then visualize the edgedata in sumo-gui: https://sumo.dlr.de/docs/sumo-gui.html#visualizing_edge-related_data
 
regards,
Jakob

Am Fr., 18. Juli 2025 um 03:59 Uhr schrieb Pedro Oliveira via sumo-user <sumo-user@xxxxxxxxxxx>:
Dear Sumo Community,

Good evening!

I'm working on a simulation network. Traffic volumes were input using a "routesampler". "Findallroutes" was used to generate the initial routes, and I'm currently verifying the routes used.

I came across the following route, which I didn't expect to occur.

image.png

The movement is this:
image.png

When running "routesampler", is there a way to avoid using this route, or to filter the generation of this route in "findallroutes"?

To generate route images, I used "plotXMLAttributes," and for analysis, I separated them into four images, each containing 10 routes, resulting in the 40 most-used routes. To obtain the 40 most-used routes, I ran "routesampler" and asked the route IDs to be entered. Then, in Excel, using a pivot table, I counted the most-used route IDs.

image.png
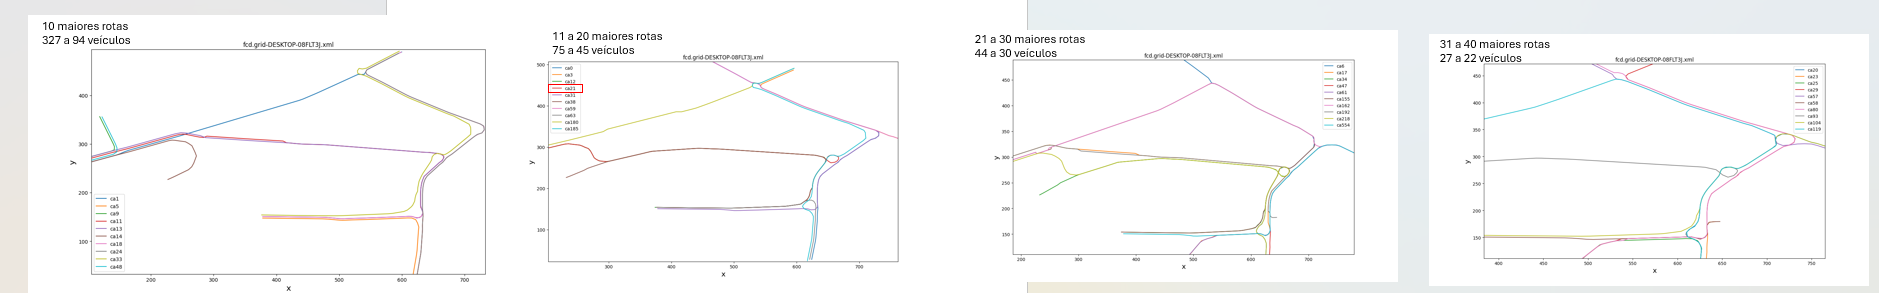
An example of the command was this:

"%SUMO_HOME%/tools/visualization/plotXMLAttributes.py" -x x -y y -o allXY_output.png fcd.grid-DESKTOP-08FLT3J.xml -i id --filter-ids ca48,ca9,ca33,ca14,ca1,ca11,ca13,ca5,ca24,ca18 --legend 

Is there a better method to perform this analysis?

Finally, I would like to know if there is any way to evaluate, between OD pairs, which routes are being used and, if possible, the volume of each route on a map.

thank you very much

Sds,

Pedro Oliveira


_______________________________________________
sumo-user mailing list
sumo-user@xxxxxxxxxxx
To unsubscribe from this list, visit https://www.eclipse.org/mailman/listinfo/sumo-user

Back to the top