Hi,
also in relation to
https://bugs.eclipse.org/bugs/show_bug.cgi?id=279638, I've done some
benchmarking. My test case is the "ImpactAnalyzer Tests" suite
launched by the "ImpactAnalysisTests with Traceback+UnusedChecks"
launch executed using the SAP JVM with the SAP Eclipse Profiler
Plug-In. Apart from impact analysis-specific initialization code,
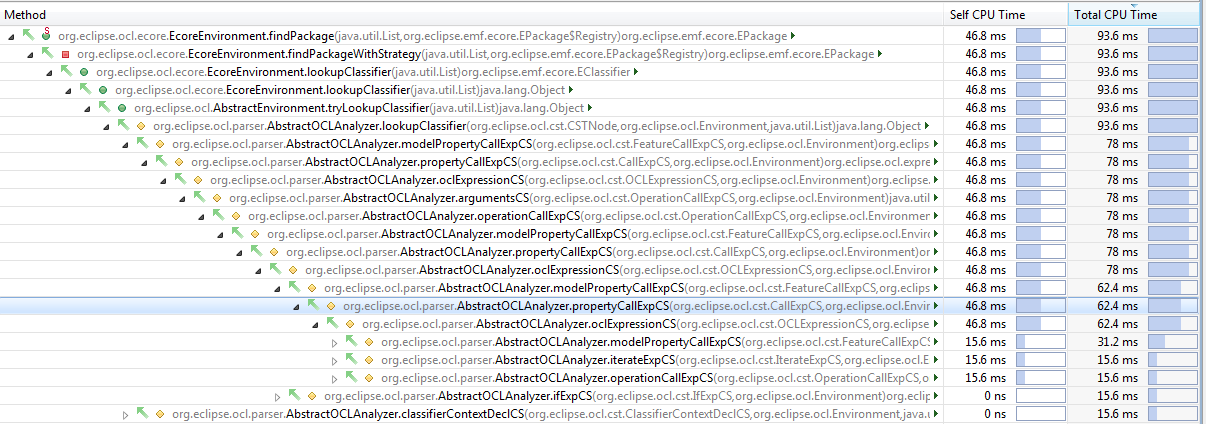
the next interesting call that sticks out w.r.t. "self time" is
Ecoreenvironment.findPackage. For reference, I put the figures
below.
Regarding total time, filtered for "org.eclipse.ocl.*", we get the
following results:
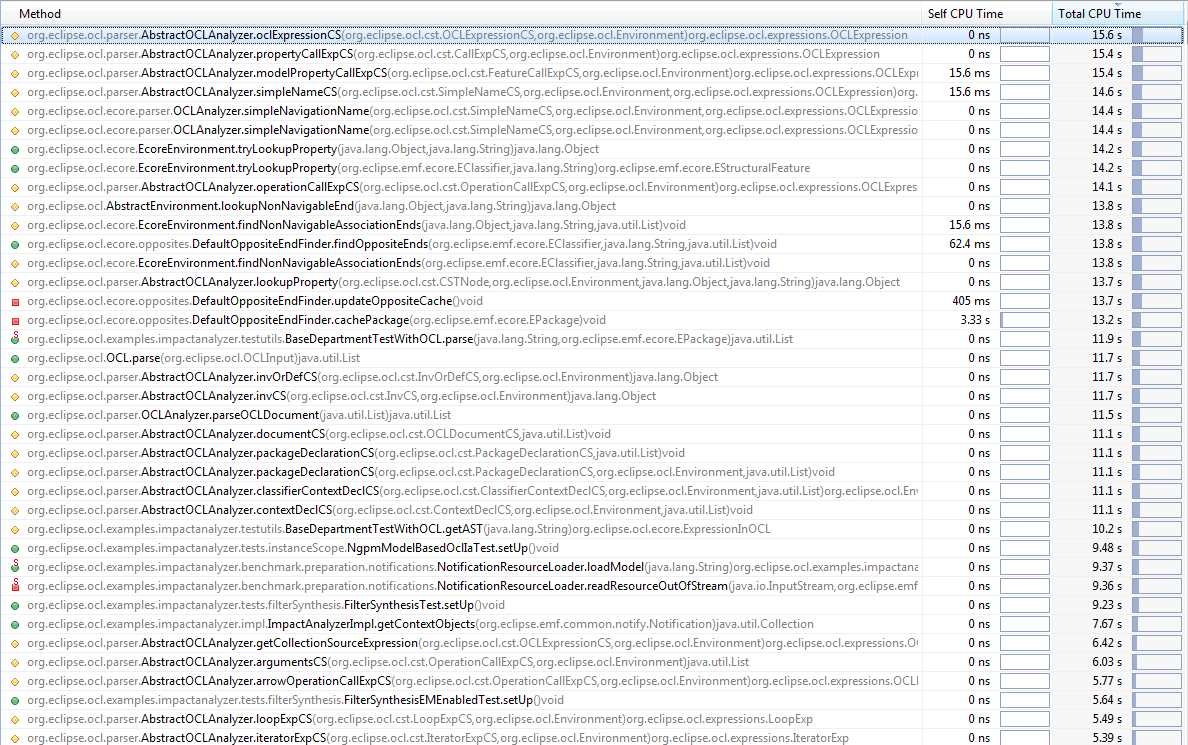
Keep in mind that this reflects many many impact analyzer (IA) runs
which involves a lot of backwards traversals which is why we also
see a significant share of DefaultOppositeEndFinder stuff which
won't show up in case of neither IA tracebacks nor explicit
OppositePropertyCallExp expressions being used.
Apart from this, for the specific test case, more time is spent
parsing/analyzing the expressions than evaluating them, it seems.
Evaluation shows up a lot further down in the list:
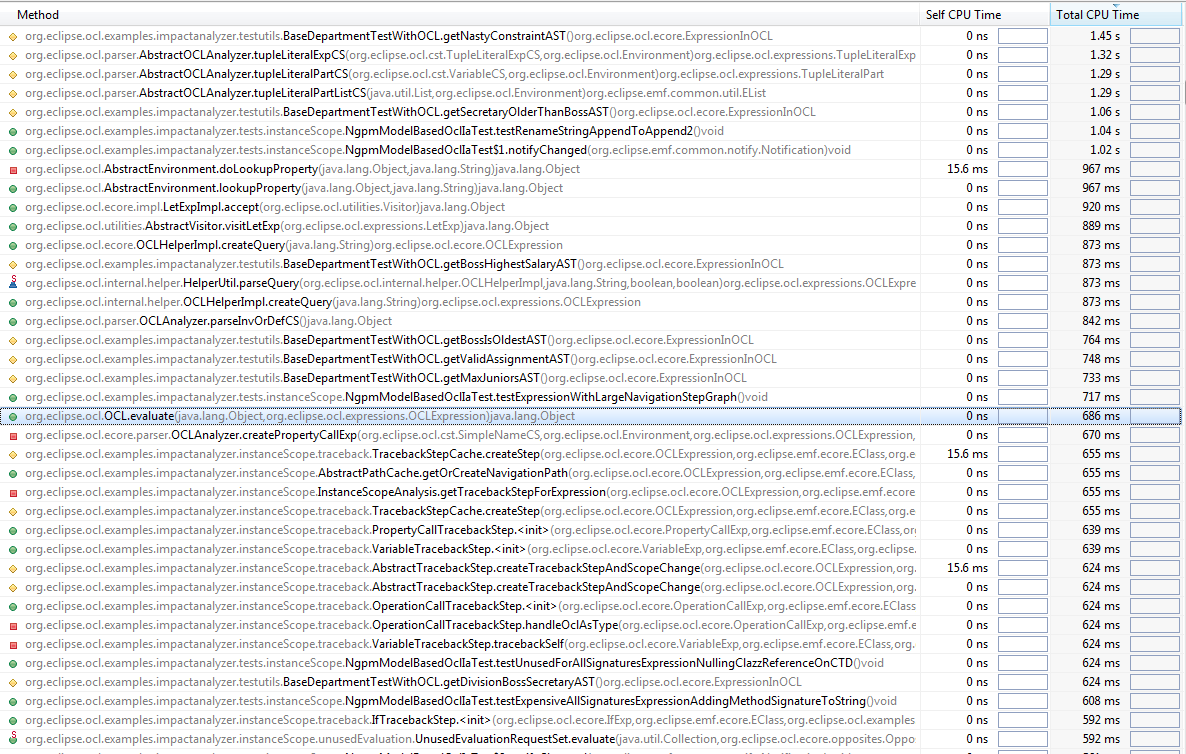
Expanding the OCL.evaluate hierarchy shows the following picture:
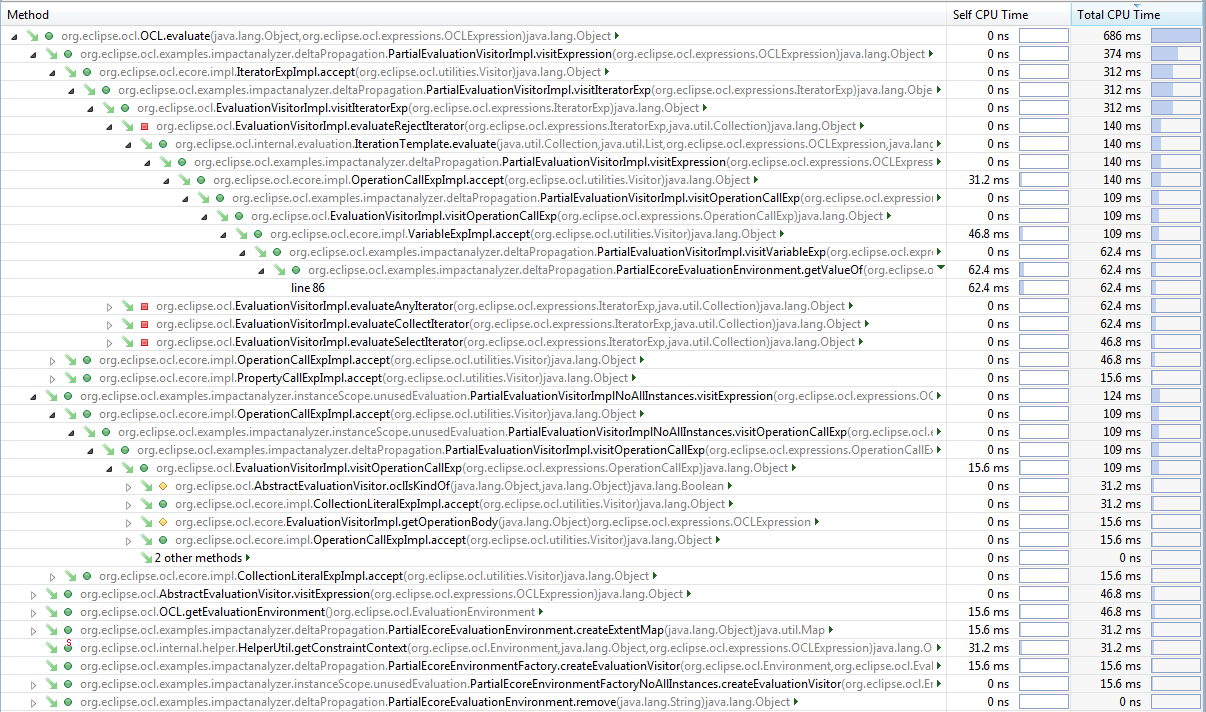
I read it like this: There is an IA-dependent "bump" in
PartialEcoreEvaluationEnvironment during partial evaluation when
unset variables are encountered which causes an exception which is
known to be time-consuming business in Java. Other than that we see
two noticeable bumps in self-time:
- OperationCallExpImpl.accept (line 390, the visitOperationCallExp
call)
- VariableExpImpl.accept (line 250)
This to me suggests that Ed is pointing in a useful direction when
it comes to comparing the execution time performance of switching by
numeric Ecore feature IDs versus employing double-dispatch to visit
polymorphically.
I'll try to get another benchmark run that is not primarily focused
on IA aspects but has more plain OCL evaluation to do. Let's see
what I can find. A good start may be the existing OCL/Ecore plugin
tests.
Best,
-- Axel
|