Quoth Alex...
Yes, either that or a plug-in in java. We can work together to fix missing capabilities.
I suggest: make a custom xml per trace type and have the xml analysis bound to parsers.
We have a monthly sync up, next wednesday. June 10th. I would love to deep dive with you on this issue.
Hi everyone,
I am currently exploring Trace Compass for the analysis of trace files generated by a proprietary product that can run on Linux/Windows for which I do not have access to the source code.
I am a bit rusty with my development skills; while I have used Eclipse in the past, I have never ventured into plugin development before. I have been attempting to set up this workflow with the help of AI, but I have hit a few technical walls that I haven't
been able to overcome on my own.
Before I proceed further, I would appreciate your guidance or confirmation on whether my proposed approach aligns with the tool's intended architecture for black-box trace analysis.
My current approach is as follows:
-
Custom Parser: I've defined an XML-based parser to map the proprietary log format to the Trace Compass trace model.
-
Analysis Logic: I tried to implement the analysis logic using State System.
-
Adapt existing analysis: for example, I tried without much luck to configure and use the In/Out analysis (not sure if the defined parser should be modified, or how to exactly configure the rules/regex etc).
Below is an example of the trace on the server product when a client connects to the server with testuser1 (it creates a new Session, identified by the PID|[TID] of the process and a session ID, then asks for ENTRY_POINTS, then AUTHENTICATE, etc.). Unfortunately,
sometimes the use "Entering", sometimes "Called" or "called".
2026-05-26T14:54:00.419907 51454[51454] 0000000000000000 [RPC] Entering NewSessionByAddr_String
2026-05-26T14:54:00.541467 51454[51454] 0103d5e48000c900 [RPC] Exiting NewSessionByAddr_String TIME(s) 0.121568
2026-05-26T14:54:00.547016 51454[51454] 0103d5e48000c900 [RPC] Called ENTRY_POINTS~SDF_AN_custom_date_order = 0~SDF_AN_custom_scan_fields = 0~SDF_AN_date_separator = /~SDF_AN_date_order = 0~SDF_AN_day_leading_zero = F~SDF_AN_month_leading_zero
= F~SDF_AN_century = T~SDF_AN_time_separator = :~SDF_AN_hours_24 = T~SDF_AN_hour_leading_zero = T~SDF_AN_noon_is_zero = F~SDF_AN_am = AM~SDF_AN_pm = PM~UTC_OFFSET = 7200~LANGUAGE = 2~CHARACTER_SET = 16~PLATFORM_ENUM = 8201~PLATFORM_VERSION_IMAGE = Linux~APPLICATION_CODE
=
2026-05-26T14:54:00.547534 51454[51454] 0103d5e48000c900 [RPC] Exiting ENTRY_POINTS TIME 0.0001680000 SQLTIME 0.0000000000
2026-05-26T14:54:00.636180 51454[51454] 0103d5e48000c900 [RPC] Called AUTHENTICATE_USER~DO_SET_LOCALE = F~CONNECT_POOLING = T~RECONNECT = F~ASSUME_USER = F~CHECK_ONLY = F~AUTHENTICATE_ONLY = F~OS_LOGON_NAME = dmadmin~OS_LOGON_DOMAIN = ~LOGON_NAME
= testuser1~USER_PASSWORD = *****~USER_EXTRA_CREDENTIAL[0]: ~ [1]: ~ [2]: f0~ [3]: ~ [4]: ~ [5]: ~CLIENT_AUTH_DATA = dfc_zlEUsac9FUIITtc2dtp5fGT0DG0a1779800040
localhost hzs0eA5cLb3Z6kHAtpLm7E706gLhsbE7Tv+55/UiuobQ5SpZ7dz819tADoIQwDiG1+hwK/rrKAZ3Ki3OzEb/mGpp1BCIpvbXUCSByyFX53VTW39w3CTXp7DlVFNbEnGMvrThHFjGQ8kQ2QIo7B8a35v2Hm+xj+1iZ3hojBxwPGx03z4ILcWdCTr96dGwlL5xBA7agO9VqGGVazcyaRgI7ts+GNuDWxBL5Mhhzv96hRjHdeFN2qatZUjJAdSUbSSz2nPh9/rN5O7gqVateDgV55dD8t266hq/bwVnzlgd1hsxX0hwNXVG8hdbmCnqZ2B9CyZRQZK1CfJcFvPUYiVj5w==~CLIENT_TOKEN
= [-27, -33, -81, -15, 91, 74, 14, 42,27, 9, 94, 93, 58, -55, -113]~UL_LOGON_TYPE = ~UL_SECURITY_INFO = ~PRINCIPAL_AUTH = F
2026-05-26T14:54:00.806365 51454[51454] 0103d5e48000c900 [RPC] Exiting AUTHENTICATE_USER TIME 0.1697460000 SQLTIME 0.0000000000
2026-05-26T14:54:00.808006 51454[51454] 0103d5e48000c900 [RPC] testuser1 at localhost(::1) called GET_ERRORS(0000000000000000) ~OBJECT_TYPE = dmError
2026-05-26T14:54:00.808043 51454[51454] 0103d5e48000c900 [RPC] Exiting GET_ERRORS TIME 0.0000010000 SQLTIME 0.0000000000
2026-05-26T14:54:00.869609 51454[51454] 0103d5e48000c900 [RPC] testuser1 at localhost(::1) called GET_SERVER_CONFIG(0000000000000000) ~OBJECT_TYPE = dm_server_config~FOR_REVERT = F~CACHE_VSTAMP = 0
2026-05-26T14:54:00.869785 51454[51454] 0103d5e48000c900 [RPC] Exiting GET_SERVER_CONFIG TIME 0.0000770000 SQLTIME 0.0000000000
2026-05-26T14:54:00.873488 51454[51454] 0103d5e48000c900 [RPC] testuser1 at localhost(::1) called FETCH_TYPE(0000000000000000) ~TYPE_NAME = dm_server_config~CACHE_VSTAMP = 1302
2026-05-26T14:54:00.873850 51454[51454] 0103d5e48000c900 [RPC] Exiting FETCH_TYPE TIME 0.0002920000 SQLTIME 0.0000000000
2026-05-26T14:54:00.944871 51454[51454] 0103d5e48000c900 [RPC] testuser1 at localhost(::1) called TIME(0000000000000000)
2026-05-26T14:54:00.944954 51454[51454] 0103d5e48000c900 [RPC] Exiting TIME TIME 0.0000060000 SQLTIME 0.0000000000
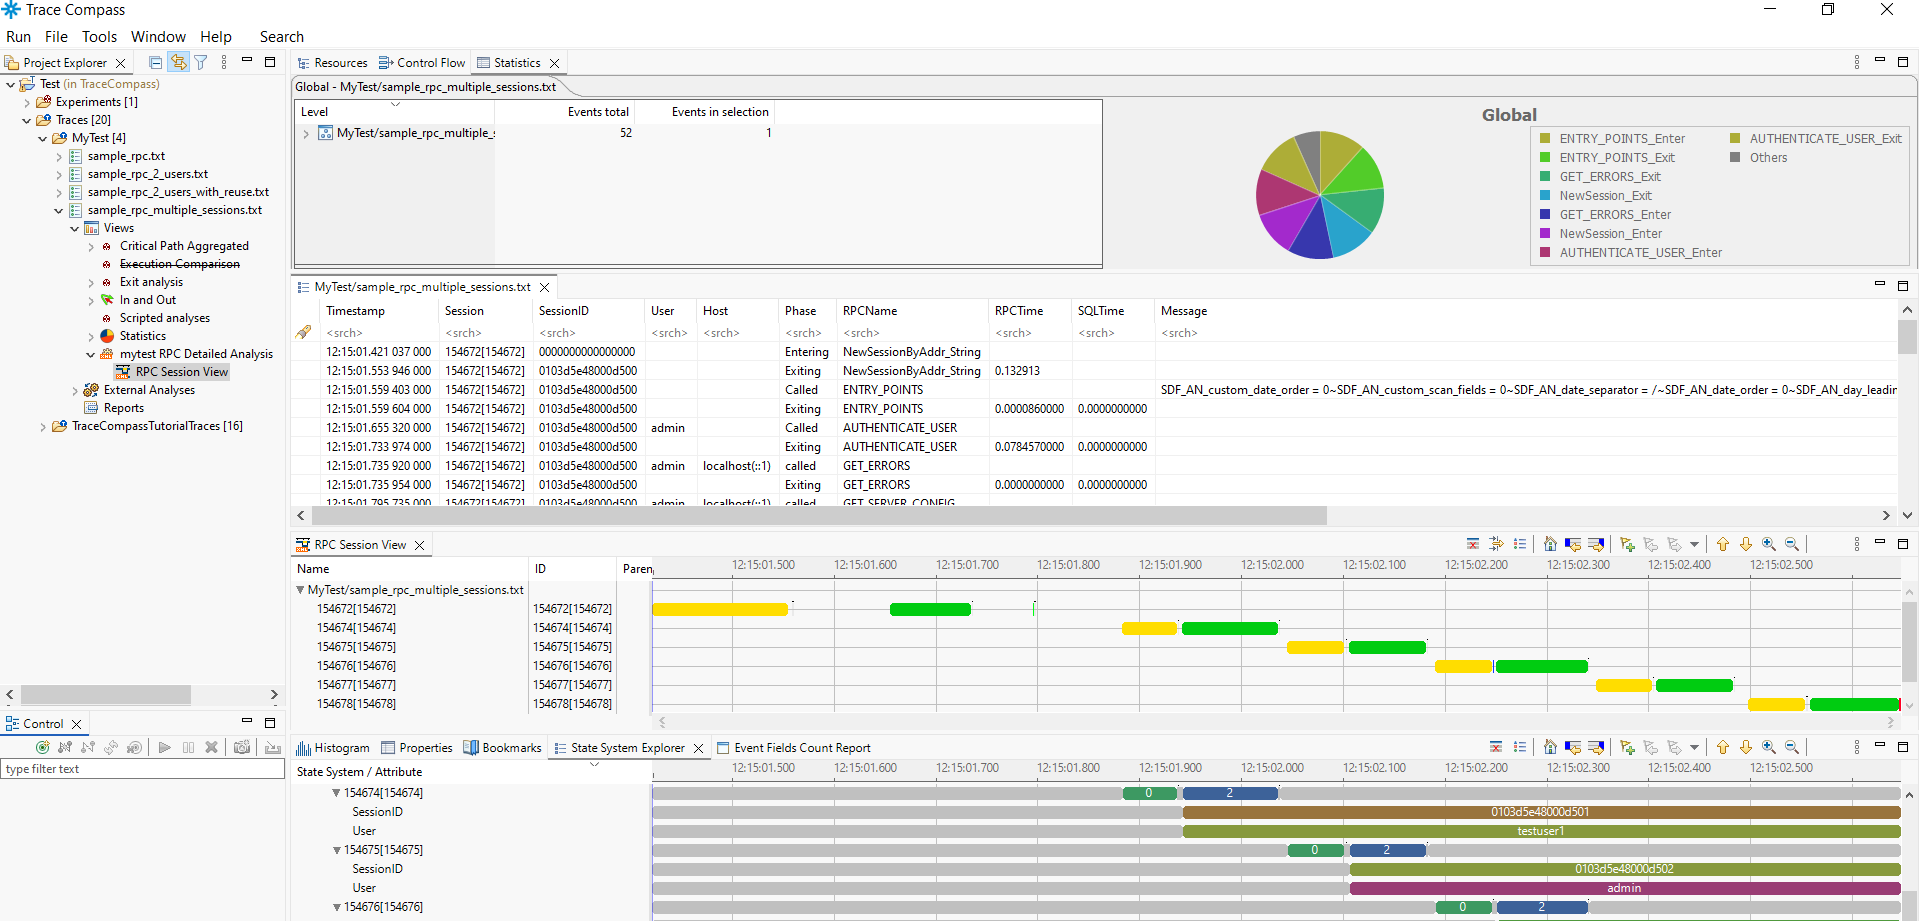
This is what I'm currently able to get with TC 11.3 with another example of trace captured when the client connects with a user and then it open new connections in sequence with other users:
I have a few specific questions:
-
Is the XML parser approach considered the standard way to handle proprietary formats, or is there a recommended alternative when dealing with non-instrumented binaries?
-
Here I'm not sure if the approach to create a root line for each rpc time is the good one or if there are better ways (also maybe to leverage other existing analyses etc)
-
The product can be configured to also enable other kind of traces, for example SQL or AUTH specific trace. So in that case, a single RPC could show multiple sublines identified by [SQL], one for each sql instruction executed to complete that specific RPC (and
there are dozens of different RPCs). How would you suggest to deal with such case?
-
Are there any best practices or known limitations I should be aware of when defining custom XML parsers for complex, concurrent users traces?
-
What would it be possible to do without programming?
-
Is it possible to get the names of the RPCs in the gantt of the RPC Session view (instead of the numbers)?
-
Are there specific areas of the Trace Compass API that you recommend I focus on for performing more advanced state-machine analysis on these parsed events?
I am quite enthusiastic about the capabilities of Trace Compass and would appreciate any feedback or pointers to existing documentation or examples that might help me refine this workflow.
I also tried to:
-
use some EASE scripting for the analysis but faced issues probably with dependencies or other that now I don't remember exactly
-
setup a local docker compose with theia-ide and trace server. I'm able to open and make one of the example traces working (e.g. the apt one), but I'm not able to make my custom trace recognized.
Not sure if this is the new recommended tool/suite, if it's intended for such custom scenario, where to go, etc...
I'm getting a bit lost 🙂
Thank you for your time and for maintaining such a powerful tool.
Attached the export package with the samples
Best regards,
Alex