[
Date Prev][
Date Next][
Thread Prev][
Thread Next][
Date Index][
Thread Index]
[
List Home]
|
Re: [tracecompass-dev] Trace Compass is slow for LTTng-UST CallStack analysis
|
Hello,
There are multiple issues with your approach:
- Babeltrace2 will not merge in one trace directory multiple
traces if the UUIDs are different. When you input those traces in
Trace Compass, then Trace Compass will not make the relationship
between the state dump of one trace to another, I will try to look
into what is possible on Trace Compass's side. Experiments are
typically used to combine multiple traces but the callstack
analysis does not make the relation between the state dump and the
events to resolve symbols.
- Another issue is that the cyg_profile tracepoints are used at
the beginning and end of each function. If you trim the trace, you
might corrupt stack information, and this might create issues with
the call stack analysis and the flame chart output. If you know
that at a specific point the upper portion of the stack does not
change then that might work.
- I am not able to reproduce the issue on my end as I currently
do not have a cyg profile trace of that size, however I have been
testing Trace Compass with larger traces and with the flame chart
view specifically and I have not encountered that amount of lag
that you are describing. The nightly build includes a patch I made
recently that should improve the performance of the flame chart:
https://download.eclipse.org/tracecompass/master/rcp/
- To diagnose performance issues, the best would be to set up the
development environment but it involves installing eclipse and it
takes a while when you set it up for the first time:
https://github.com/eclipse-tracecompass/org.eclipse.tracecompass/blob/master/DEVELOPMENT_ENV_SETUP.md
If you need any help or you can maybe share the trace that you
are using, I would be happy to test it on my end.
Best,
Arnaud Fiorini
On 2025-01-12 9:56 p.m., obelix42 via
tracecompass-dev wrote:
Hello
again,
Regarding the issue with displaying function names in
the flame chart, I have identified the root cause.
To work with a smaller trace file, I trimmed the trace file
to a small interval (not starting from the beginning) using
babeltrace2. This was necessary due to the sluggish
performance of Trace Compass when loaded with a large trace
file.
babeltrace2
--begin=23:29:41 --end=23:29:42 <input>
--output-format=ctf --output=<trimmed-output>
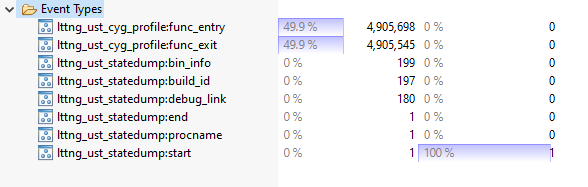
In the trimmed trace, it doesn't
contain lttng_ust_statedump:* events which I believe are
needed by trace compass for the resolving the function names
from the address.
As a workaround, I tried to create two trimmed traces
files: one that includes the lttng_ust_statedump:* events and
a second one that contains a function entry/exit events from a
small interval.
I then attempted to merge them into one trace:
babeltrace2
--input-format=ctf trace_statedump trace_small_interval
--output-format=ctf --output=trace_merged
In
the trace_merged directory, there are two separate
directories, so it seems that a real merge did not occur.
Additionally,
after loading the merged trace into Trace Compass, it is still
treated as two separate trace streams. The second stream,
which does not contain the statedump events, cannot display
the function names correctly. It appears that the metadata
from the first stream is not being used to process the second
stream.
Is
there a flaw in my approach (e.g., merging using
babeltrace) or could you suggest some pointers to fix this
issue?
Thanks,
K.
On Sunday, January 12th, 2025 at
12:15 AM, obelix42 via tracecompass-dev
<tracecompass-dev@xxxxxxxxxxx> wrote:
Dear experts,
I am trying to profile a multi-threaded application
(built with -finstrument-functions -g) running on a Linux
based embedded system using LTTng for function tracing and
Trace compass for analyzing. But Trace Compass is
extremely slow in processing the traces that renders it
almost unusable. Here are the steps I followed:
- collected
function entry and exit traces from the remote
Linux system using LTTng. resulting in a trace
file of ~700MB
- and
imported the trace in Trace Compass. There are ~10
Million events in the trace file.
I clicked on Lttng-UST CallStack -> Flame
Chart.
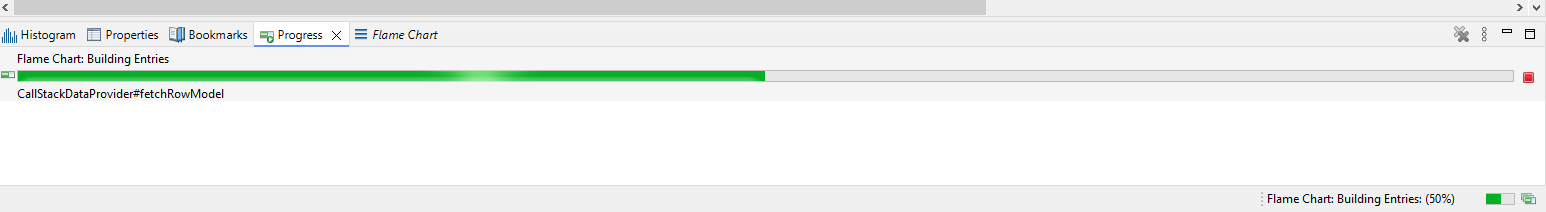
The Flame chart is generated but in the Progress
tab, it is stuck at 50% for ever. Navigating the
Flame chart view is painful: many times, Trace compass
become non responsive and then have to wait for several
minutes to be able to use it again.
Also, Flame Graph and Function Duration
Statistics are not generated.
I have got similar experience with Lttng-UST CallStack
(new) as well.
Questions on performance:
1. Isn't trace compass designed to handle large
trace files e.g., 10 Million events from multithreaded
(~100 threads) programs? When I tried to use a trimmed
trace file (with ~100K events), it is working just fine.
2. Any hints to improve the performance of trace
compass? My laptop is a powerful one (8 core, 128GB RAM)
and Trace compass is not really using much cpu/memory
even when it is generating Flame chart. I tried to
increase the heap size to 10GB (-Xms1g -Xmx20g in .ini
file), but it is not helping.
3. How to debug the issue of trace compass
getting stuck - e.g., from the trace compass logs to see
where trace compass is really getting stuck?
Question on addresses
to function names mapping:
I have provided a text file containing the
address to symbol name mapping (generated with nm -C
<executable/shared lib>) in the flame chart view .
Even after that, I am only getting function addresses in
the flame chart and not the symbol names.
- How
can I debug this issue - e.g., by looking at the
actions performed by trace compass after I supply
these files?
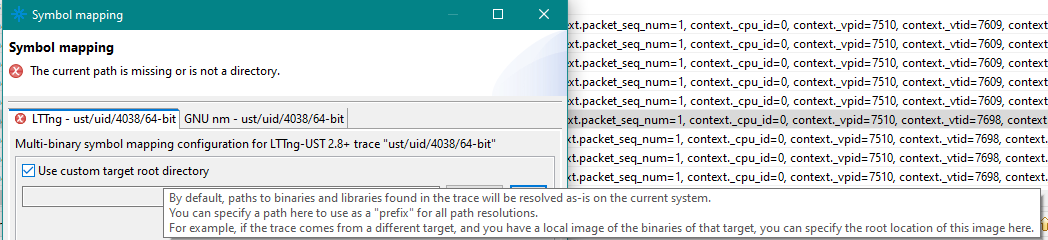
- My traced
program is composed of an executable and multiple
shared libs (.so). If I have to use the "the
root location of the binaries of the trace target"
option from flame chart, how can I find out the right
path to be given in the "custom target root
directory"?
Versions
Trace compass version:
trace-compass-10.2.0-20241204-1911-win32.win32.x86_64
JVM version: jdk-17.0.12_windows-x64_bin.msi
Thanks,
K.
_______________________________________________
tracecompass-dev mailing list
tracecompass-dev@xxxxxxxxxxx
To unsubscribe from this list, visit https://www.eclipse.org/mailman/listinfo/tracecompass-dev