[
Date Prev][
Date Next][
Thread Prev][
Thread Next][
Date Index][
Thread Index]
[
List Home]
|
[tracecompass-dev] XML file for the additional XY chart
|
Dear all,
I have tried to use this software
https://github.com/SaiSreeG1/Trace-compass--Data-driven-analysis that could auto-generate the XML file Matthew has sent as the resource, but it seems like the lady only uploaded three text files, and none of them is related to the software repository she
mentions in the readme file.
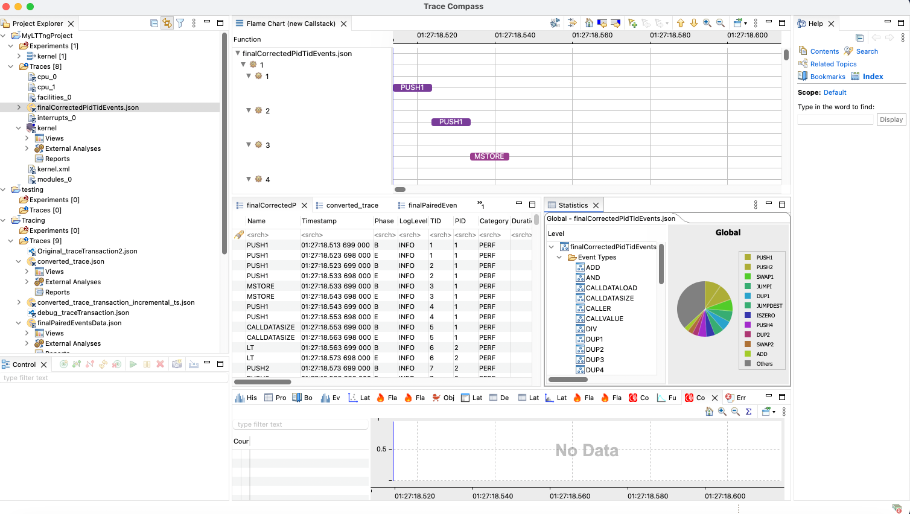
I had generated an XML file to plot the timestamp with the gas fee but could not get the imported XML file generated out the window with such a plot. I am not sure which part went wrong. I have tried two more files for the XY chart. These files are in
the xmlXYchart folder.
The target additional window I am trying to have in my trace compass view is this.
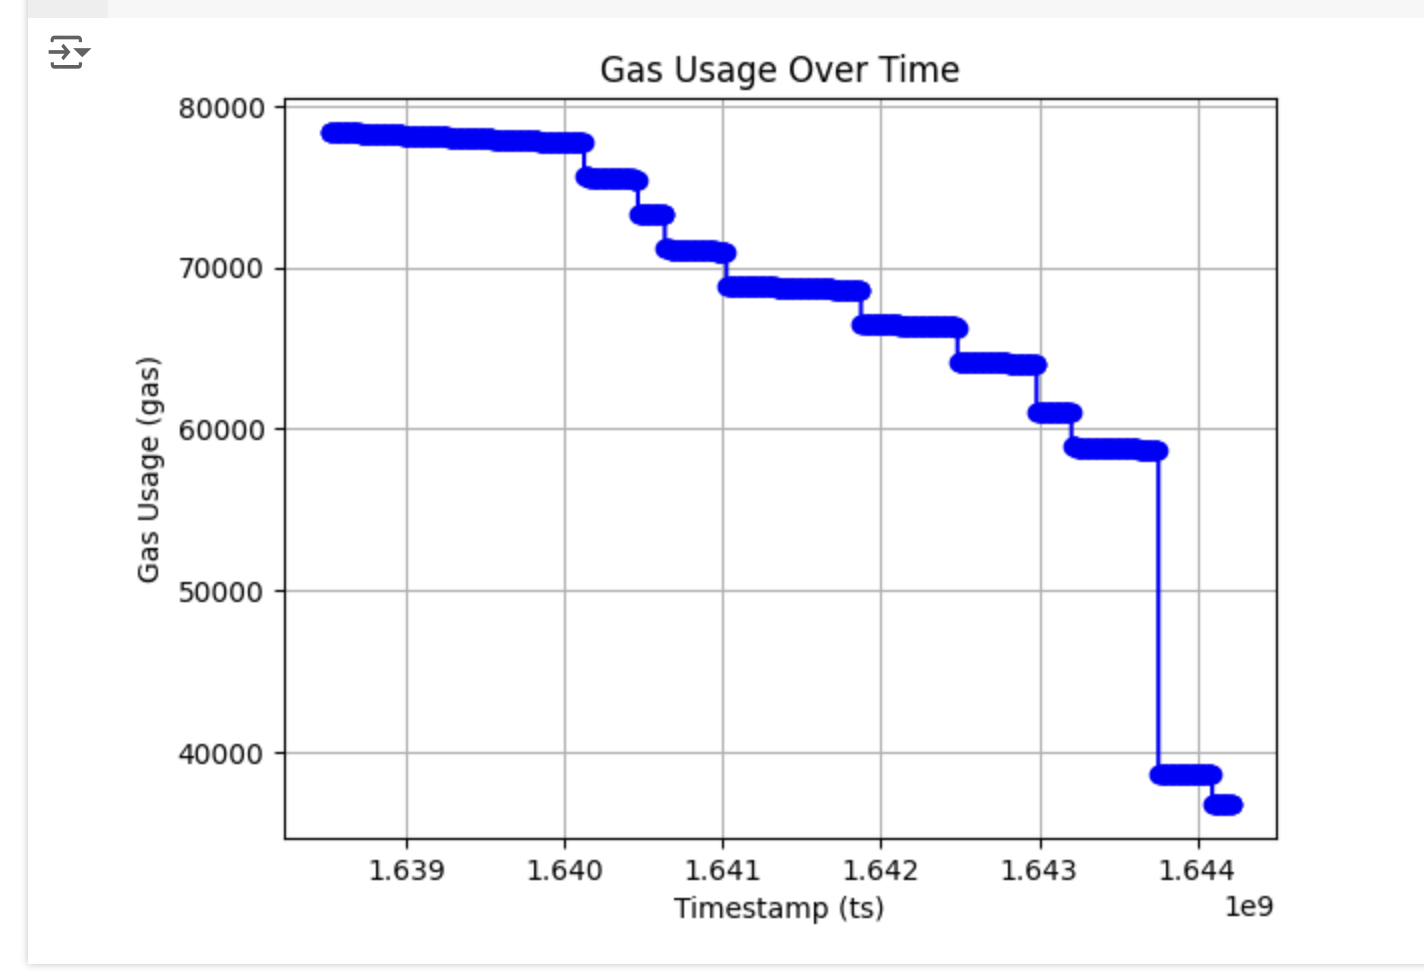 I
can plot this easily by uploading the XML file folder with the name gasUsageChart.xml, which only contains the timestamp and the gas fee as the data pair. I
can plot this easily by uploading the XML file folder with the name gasUsageChart.xml, which only contains the timestamp and the gas fee as the data pair.
Do you have any suggestions on how I could get the desired XY chart from the Eclipse Trace Compass? I did see some error messages, but those were complaining about the flame chart diagram, and I am not sure how to debug the plugin in that sense.
Best,
|
Attachment:
gasPlotting.xml.zip
Description: gasPlotting.xml.zip
Attachment:
xmlXYchart.zip
Description: xmlXYchart.zip
<<< text/html; name="desiredXYchart.html": Unrecognized >>>