|
Hi Claudia,
Thanks for sharing this success story. I'm sincerely thrilled this could help. It's a fun use case especially since it handles data at a millisecond/second level so I'm also happy to see our analyses worked well out of the box.
if you can share the XMLs, I can post them on the wiki. :)
BR
Matthew
From: tracecompass-dev-bounces@xxxxxxxxxxx <tracecompass-dev-bounces@xxxxxxxxxxx> on behalf of Claudia Dallaire <claudia.dallaire@xxxxxxxxxxxx>
Sent: Monday, September 30, 2019 8:18 AM
To: tracecompass-dev@xxxxxxxxxxx <tracecompass-dev@xxxxxxxxxxx>
Subject: [tracecompass-dev] Example use of Tracecompass for Gerrit logs analysis
Hi all,
I thought that this audience would be interested about a success story that my team had with using Tracecompass lately.
The scenario was a service outage of a Gerrit instance. Tracecompass allowed us to easily aggregate data from an upstream reverse-proxy and Gerrit. With this data in hand, and using custom filters as well as XML analysis, we traced-back to two causes for the
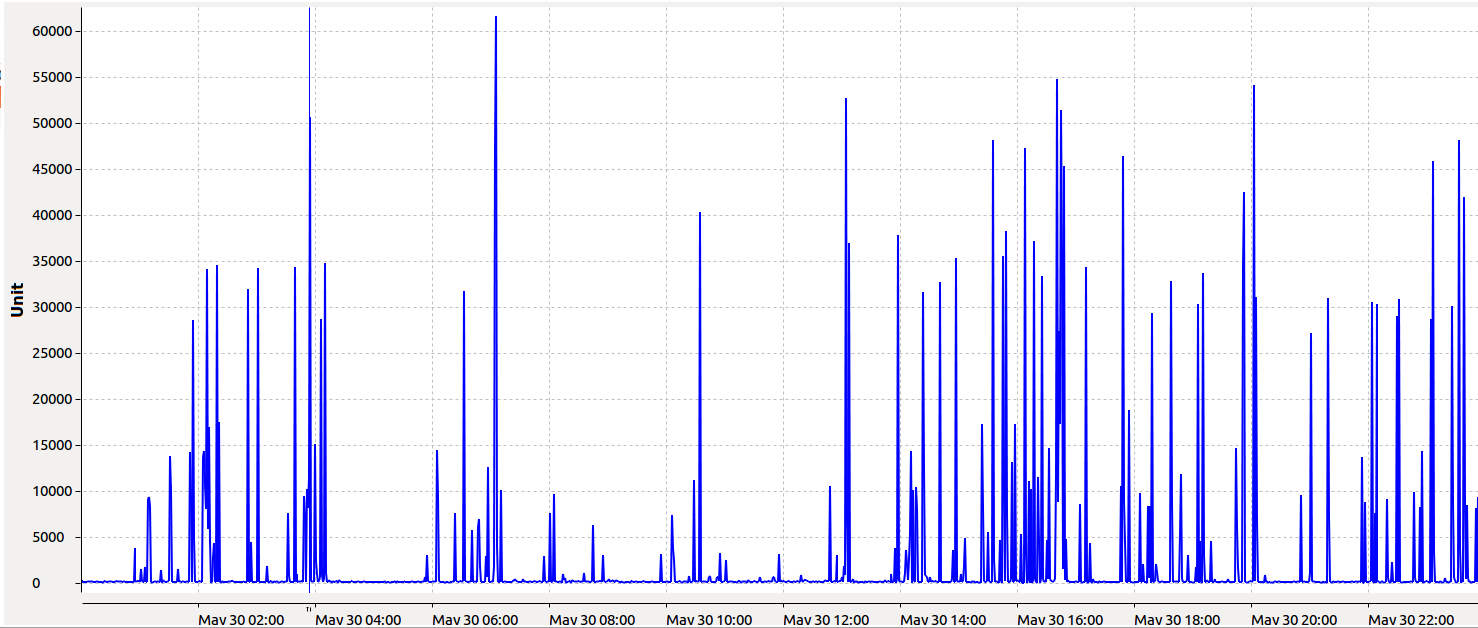
outage. The first one was found while producing a graph of the duration that our server spent on honouring requests over time, per user (refer to figure 1). This graph allowed to establish that specific users were causing steep peaks in resource usage. The
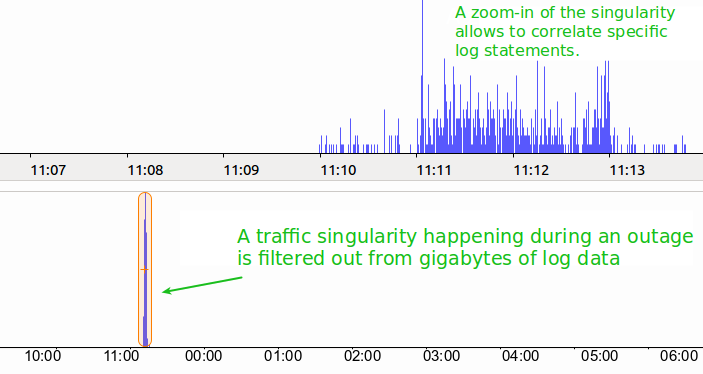
second cause was found while custom-parsing gigabytes of log data, and lead us to identify specific log statements that only happened during the outage (refer to figure 2).
Regards,
Figure 1
Figure 2
Claudia Dallaire
|