
[Date Prev][Date Next][Thread Prev][Thread Next][Date Index][Thread Index] [List Home]
Re: [swtchart-dev] How to center the PieChart?

Hi Himanshu,

thanks for the quick response to center the charts. Great!

In my application, I cannot just work with strings and doubles for pie charts. The labels are entered by the user and therefore I cannot use them as identifiers. Therefore I am looking for example to work with the data model directly.


This is my current code snippet:

----8<----------------

ICircularSeries<?> circularSeries = (ICircularSeries<?>) chart.getSeriesSet().createSeries(SeriesType.DOUGHNUT,
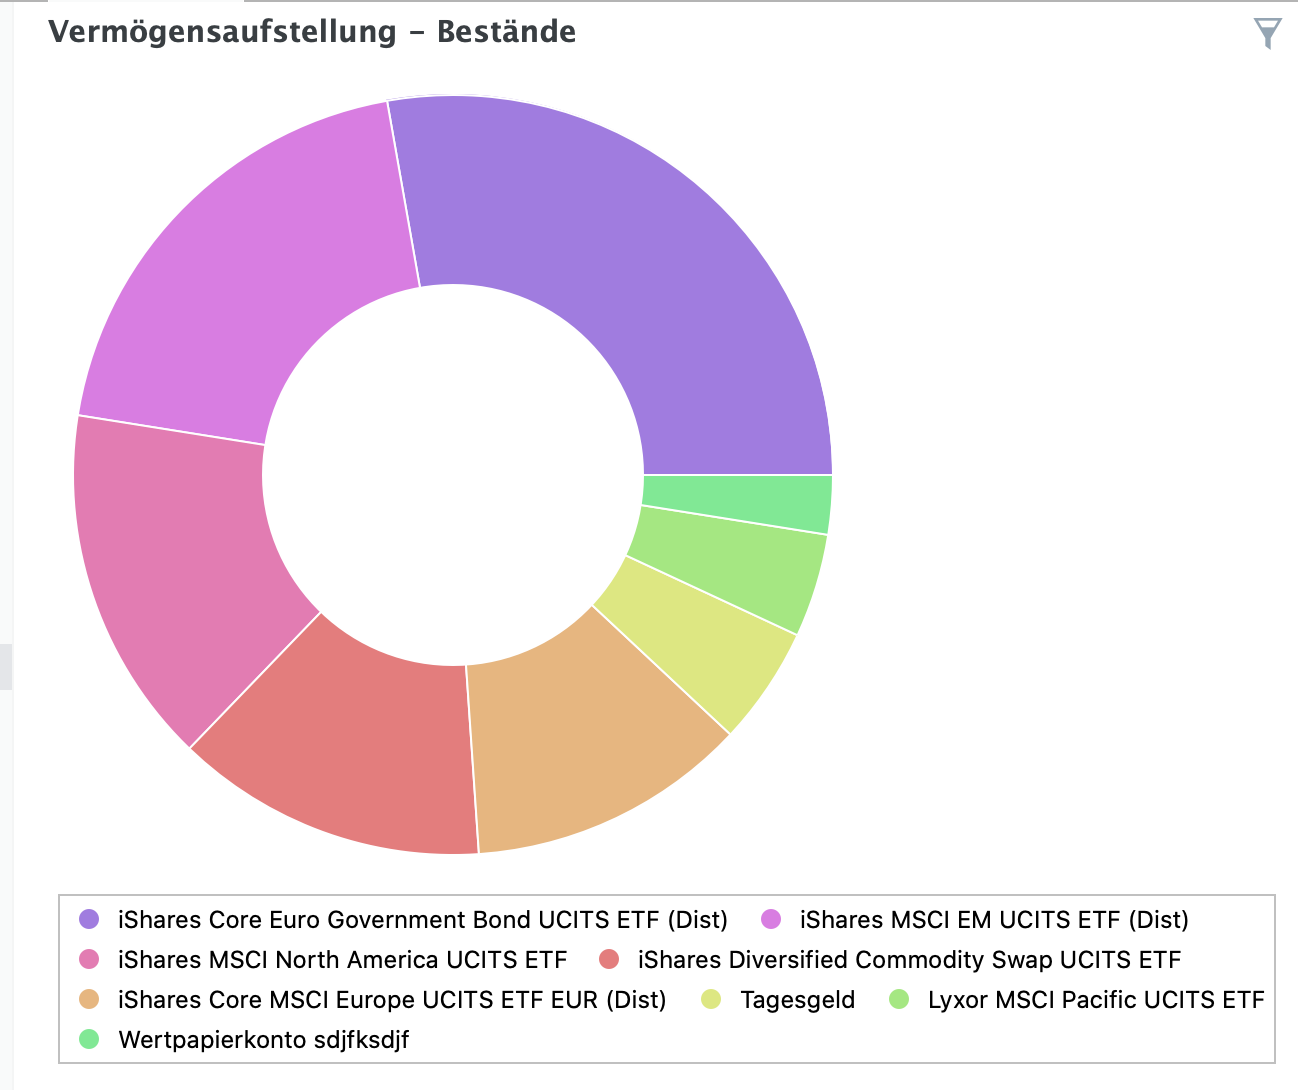
                Messages.LabelStatementOfAssetsHoldings);

IdNodeDataModel data = "">
// root node must inherit background color (dark mode)
data.getRootNode().setColor(chart.getBackground());

snapshot.getAssetPositions() //
                .forEach(p -> {
                    Slice slice = new Slice(p.getDescription(),
                                    p.getValuation().getAmount() / Values.Amount.divider(), data.getRootNode());

                    slice.setColor(colorWheel.next());
                    slice.setData(p);
                });

data.update();

----8<----------------

Couple questions:

Even though I am setting the color, it is reset to some default values. When using the Model, can I pass the colors directly? If I call #setColors, then series are resolved using the label (which might not be unique in my cases) - see https://github.com/eclipse/swtchart/blob/develop/org.eclipse.swtchart/src/org/eclipse/swtchart/internal/series/CircularSeries.java#L191
The datamodel#update method resets the colors, but if I do not call model#update, no data is shown

I did extend the "Node" class now to add a "data" object. It allows me to attach the actual object. Is this a meaningful extension to the API?

About labels: is the drawing of labels next to (or inside) the pie slices supported? I tried the following code but to no avail.
  circularSeries.getLabel().setVisible(true);


Thanks!

Andreas.


Am So., 10. Okt. 2021 um 03:45 Uhr schrieb Himanshu Balasamanta via swtchart-dev <swtchart-dev@xxxxxxxxxxx>:
Also, code example for complexer 
It is worth mentioning that you can change from Pie Chart to Doughnut Chart by changing SeriesType.PIE to SeriesType.DOUGHNUT in the code.

Hope this helps.

Best
Himanshu Balasamanta,
GSoC 2020, Eclipse (Implementing CIrcular Charts).

On Sun, Oct 10, 2021 at 12:36 AM Andreas Buchen <andreas.buchen@xxxxxxxxx> wrote:

Quick question: How can I center the pie chart?

As you can see from the screenshot, the legend is placed at the bottom. I would love to have the pie chart centered.

Bildschirmfoto 2021-10-09 um 20.25.13.png

And: does anybody have sample code with more complex examples. SingleLevelDoughnutChartExample is very simple and does not use the model. tracecompass seems to (still?) use their own implementation.

Thanks,

Andreas.
_______________________________________________
swtchart-dev mailing list
swtchart-dev@xxxxxxxxxxx
To unsubscribe from this list, visit https://www.eclipse.org/mailman/listinfo/swtchart-dev
_______________________________________________
swtchart-dev mailing list
swtchart-dev@xxxxxxxxxxx
To unsubscribe from this list, visit https://www.eclipse.org/mailman/listinfo/swtchart-dev

Back to the top