[
Date Prev][
Date Next][
Thread Prev][
Thread Next][
Date Index][
Thread Index]
[
List Home]
|
Re: [sumo-user] TimeLoss / veic
|
Good evening, Thank you very much! Would it be possible to also include TimeLoss/vehicle in the output in the next version? It can be calculated as a column: TimeLoss / flow or by the formula: travel time * (1 - relative speed). This parameter is useful for attempting a comparison with the Level of Service of intersections according to HCM. Thank you again for your help! Regards, Pedro Oliveira
The upcoming release of 1.25.0 includes fixed density values and also includes 'flow' directly in edgeData output.
regards,
Jakob
Good morning!
Thank you very much, it worked.
However, I have a question regarding the calculated flow.
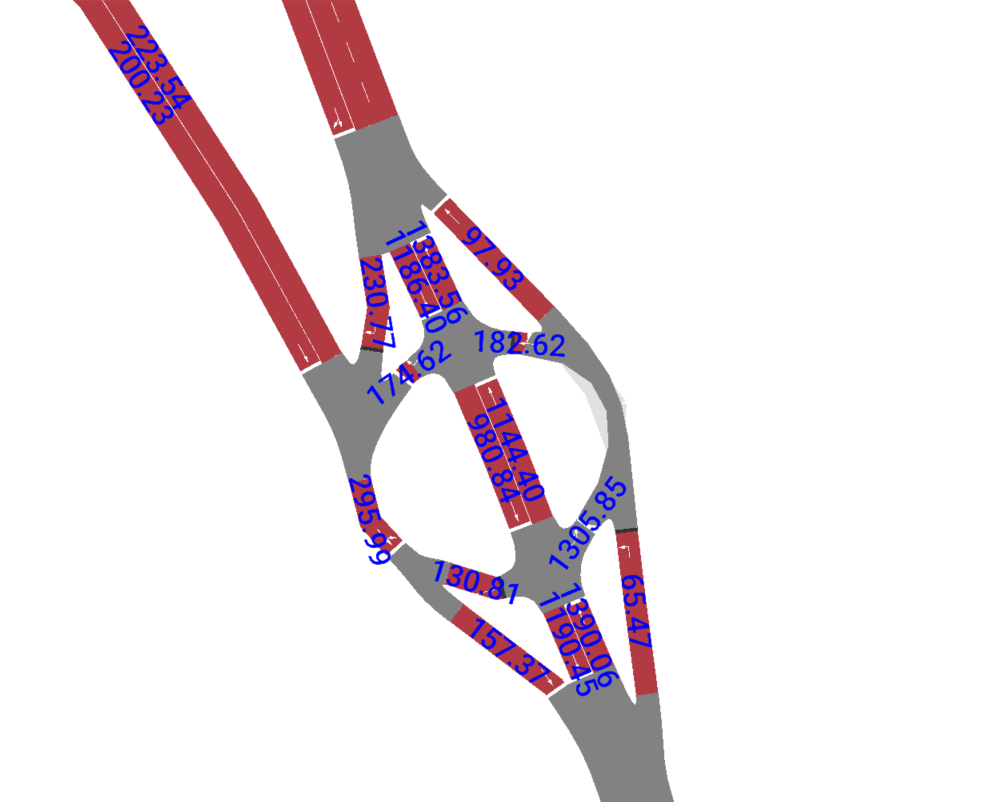
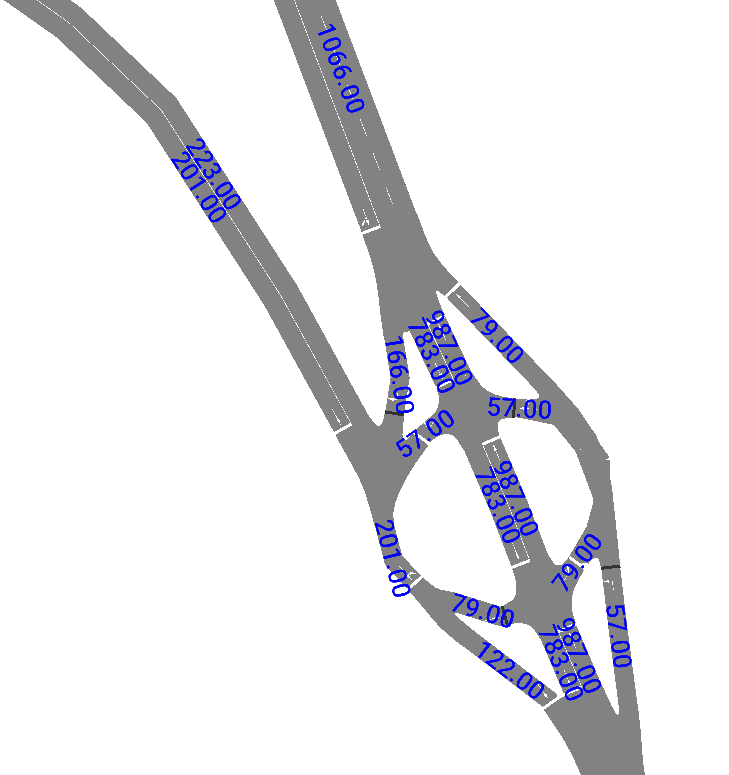
In the following figure, we have the intended flow obtained by "count edge usage." This value is close to what we set our detectors to when validating our network; our detectors registered slightly lower values.
However, when obtaining the flow using the formula: Vel x 3.6 x Densi, some values were outside the expected range, and watching the simulation, we don't actually have the calculated flow.
Could you help me?
Sds,
Pedro Oliveira
In principle, this approach works, but with an extra step because excel is bad in saving the desired xml.
The approach below requires sumo version 1.24.0 or later.
- in your additional file where you define the edgeData output, set output file extension to csv: file="output.csv"
- load the csv in excel, prefix any new column with 'edge_' ( i.e. edge 'edge_flow')
- convert the csv into the required xml format by calling
python %sumo_home%\tools\xml\csv2xml.py output_modified.csv -o output_modified.xml -x %sumo_home%\data\xsd\datamode_file.xsd
- load output_modified.xml in sumo-gui
The alternative would be a small python script along the lines of
regards,
Jakob
I would like to generate a visualization map of the edges with the variable TimeLoss/vehicle, that is, an average of the time lost in seconds / vehicle.
The SUMO output of edgedata-output, for example, provides the total edge timeLoss, and I can obtain the timeLoss per vehicle if, after outputting the file, I add a column of the traffic volume obtained by:
Average traffic volume (#/h) = speed * 3.6 * density
And then another column with the division of timeLoss / flow.
My intention is to perform these calculations with Excel and then save as XML and load it into SUMO in Open EdgeData.
Is this possible?
If so, is there a more practical method?
Thank you in advance.
Regards,
Pedro Oliveira
_______________________________________________
sumo-user mailing list
sumo-user@xxxxxxxxxxx
To unsubscribe from this list, visit https://www.eclipse.org/mailman/listinfo/sumo-user