[
Date Prev][
Date Next][
Thread Prev][
Thread Next][
Date Index][
Thread Index]
[
List Home]
|
[sumo-user] Question about HBEFA4 emission model
|
Dear all,
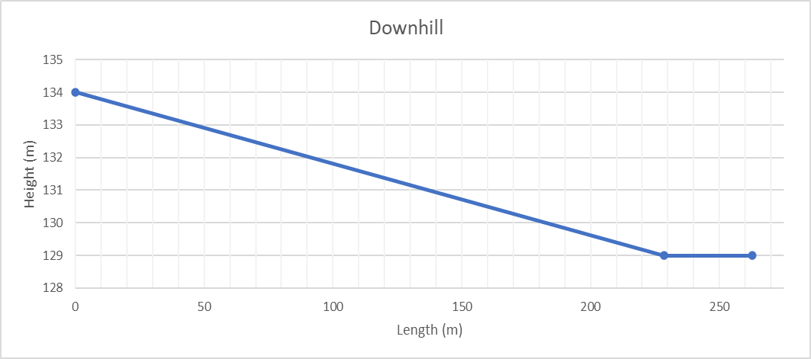
I have modeled an example road stretch with an uphill slope of 2%, and vice versa a downhill slope of -2% going the opposite direction. A traffic light is situated between the 200 – 250 m mark. I created a peak morning scenario (8 to 9
a.m.) using a given vehicle fleet composition and wanted to see the difference in emission behavior (HBEFA4-based) (https://sumo.dlr.de/docs/Models/Emissions/HBEFA4-based.html) for an
uphill and downhill slope using an aggregated measure (edge) (https://sumo.dlr.de/docs/Simulation/Output/Lane-_or_Edge-based_Emissions_Measures.html). A brief
explanation of the scenarios are as follows:
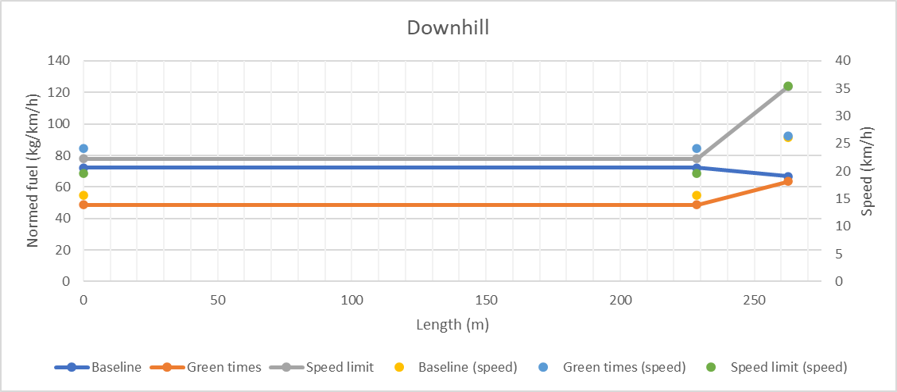
- Baseline: base case, green light period 36 s (total cycle: 90 s), speed limit 30 km/h
- Green times: extension of green light periods to 72 s
- Speed limit: increase of speed limit to 50 km/h
Attached you receive the resulting plot of normed fuel (line) & speed (dot) with respect to road length. The speed on the secondary axis is the mean speed on the edge (https://sumo.dlr.de/docs/Simulation/Output/Lane-_or_Edge-based_Traffic_Measures.html).
I noticed that the normed fuel increases for a speed limit of 50 km/h where I would have expected it to decrease. For Euro 4 to Euro 6d petrol & diesel passenger cars, fuel consumption emission factors (in g/km) decreases with increase of speed limit from
30 km/h to 50 km/h (based on HBEFA 4.2 database). Would you perhaps have an explanation for this?
I would appreciate any suggestions as I am still new to the software. Thank you in advance.
Warmest regards,
Addina
|
Attachment:
Elevation profile.png
Description: Elevation profile.png
Attachment:
Normed fuel and speed.png
Description: Normed fuel and speed.png