[
Date Prev][
Date Next][
Thread Prev][
Thread Next][
Date Index][
Thread Index]
[
List Home]
|
Re: [sumo-user] Arriving to a traffic break-down and observing dynamic shockwaves ( / phantom traffic jams)
|
Thank you very
much for your answer Jakob, you helped me a lot!
I have 3
more questions:
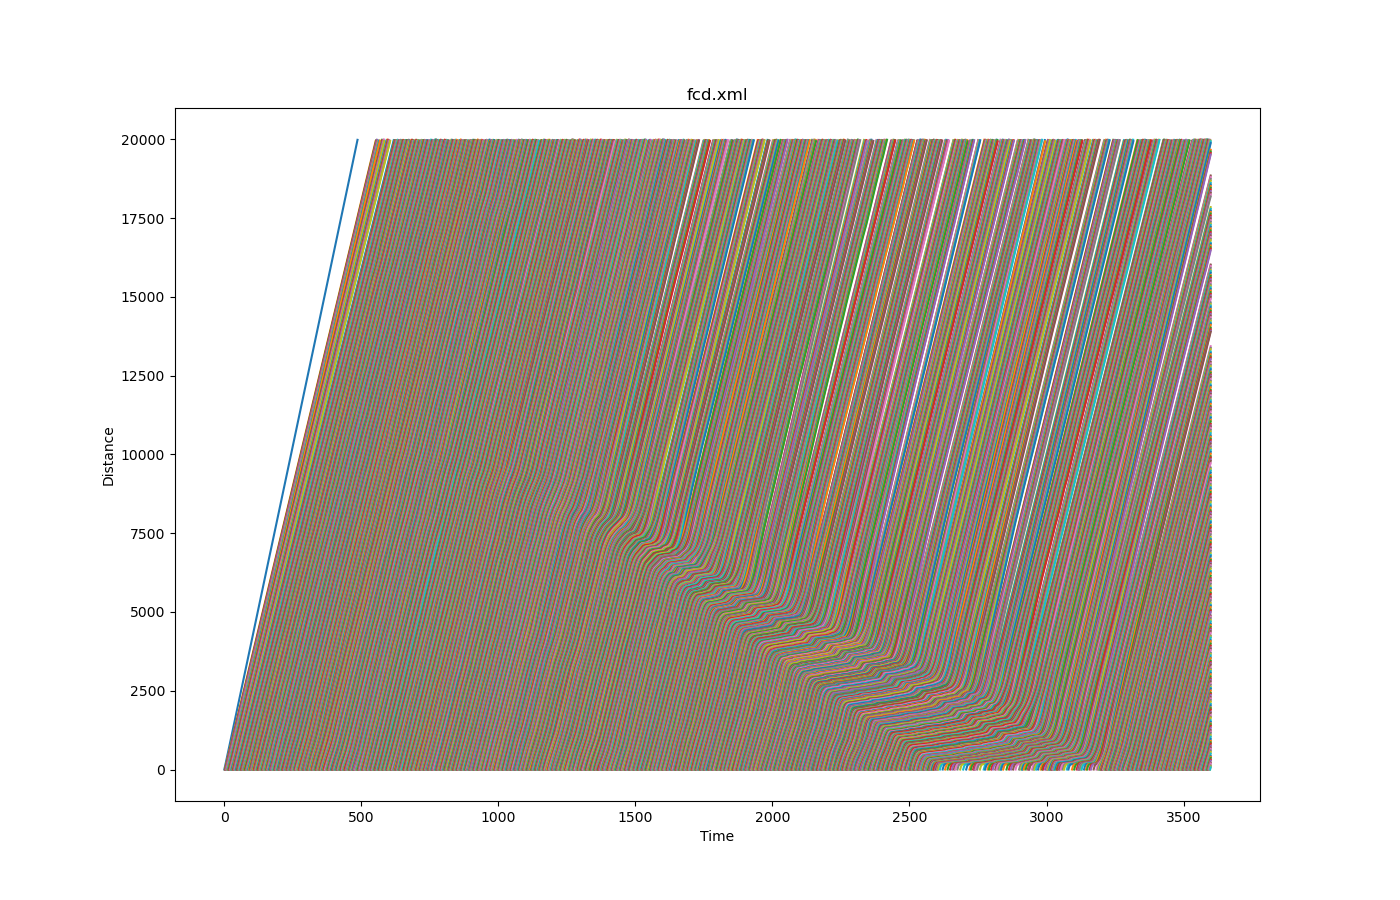
1. I have noticed
that the attached test case which consists of a 1 hour 3000 veh/hr flow along 20
km of road performs just a single shock wave. Is it considered to be a
realistic scenario? If not - what can be
done to make it more realistic? Which Vtype (or other) attributes do you recommend
to edit in case of a 2 lanes scenario?
2. I used the SUMO plot_trajectories tool and noticed that the graph looks very clean and maybe
less realistic. How can I improve it?
3. What is the
reason that the road is divided into 100 sections? Can it affect the simulation
results?
Sincerely,
Dvir
Hello,
you can download a test case that shows breakdown of flow at
The test case collects traffic data which can be used to plot a fundamental diagram with
sumo/tools/visualization/plotXMLAttributes.py edgedata.xml -i id -x density -y left -s --scatterplot --yfactor 60 --ylabel vehs/hour
It's pretty hard to observe spontaneous breakdown on a straight road because the disturbances travel upstream and take a while to develop into a full jam. For this reason the test uses 20km of road.
regards,
Jakob
Hello,
I am trying to generate a realistic scene of a traffic break-down which is followed by many dynamic moving shokwaves in various lengths and speeds.
In order to reach that road condition, I have modeled a simple 2 lane 4 km long straight road and inserted a high traffic flow (more than 2000 veh/hr/lane). However, no real serious shokwaves were observed.
I was trying different car-following models which SUMO offers and edited their and the general Vtype attributes values. I have even decreased simulation time-step to 0.001 sec but still didn't succeed although high traffic values were observed (for example: Qmax = 2250veh/hr/lane, Km = 24veh/km, Vm = 94km/hr ).
I will be glad to hear any suggestions for solving this problem and observing shockwaves which are caused just by the high density of vehicles in the road and not by an artificial interference such as adding ramp-in / generating a bottleneck / changing one car's speed or the road's shape / inserting non realistic Vtype's attribute values etc.
Sincerely,
Dvir
_______________________________________________
sumo-user mailing list
_______________________________________________
sumo-user mailing list
Attachment:
plot.png
Description: PNG image