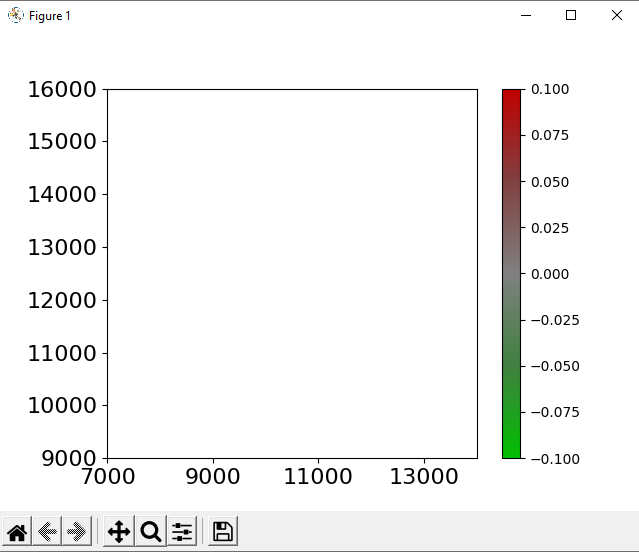
I am trying to plot the edges emission using plot-net-dump.py.
1. I know we use edgeData to output edge emission measures used in the python script:
<edgeData id="<DETECTOR_ID>" type="emissions" freq="<FREQUENCY>" file="<OUTPUT_FILE>" [excludeEmpty="true"]/>
But I don't know how to create a detector, since "id" here refers to detector id.
2. so I created an additional file looking like that:

and my edgeData :

Then I ran the script:
python D:\AGETIPA\SUMOLOG\tools\visualization\plot_net_dump.py -v -n D:\AGETIPA\PROJETS\21-05-21\8h10h\activitygen-example.net.xml --xticks 7000,14001,2000,16 --yticks 9000,16001,1000,16 --measures NOx_normed,NOx_normed--xlabel[m]--ylabel[m] --default-width 1 -i D:\AGETIPA\PROJETS\21-05-21\8h10h\in\add\67h8-10.aggregatedemission1_edge.xml,D:\AGETIPA\PROJETS\21-05-21\8h10h\in\add\67h8-10.aggregatedemission1_edge.xml --xlim 7000,14000 --ylim 9000,16000 --default-width .5 --default-color #606060 --min-color-value -.1 --max-color-value .1 --max-width-value .1 --max-width 3 --min-width .5 --colormap #0:#00c000,.25:#408040,.5:#808080,.75:#804040,1:#c00000
And this is the result :
There's nothing showing.
What did I do wrong?
I attached the edge emission output file in case it's needed.
Thanks,
Ranarivelo Voahangy Antsa


