Hi,
I've now measured the OCL/ecore plugin tests using the regular
launch config "org.eclipse.ocl.ecore.tests (Plugin)", again using
the SAP JVM (which is a derivative of the Java 1.6 Hotspot VM).
Below are the plain results sorted by decreasing Self CPU Time,
filtered for org.eclipse.ocl.
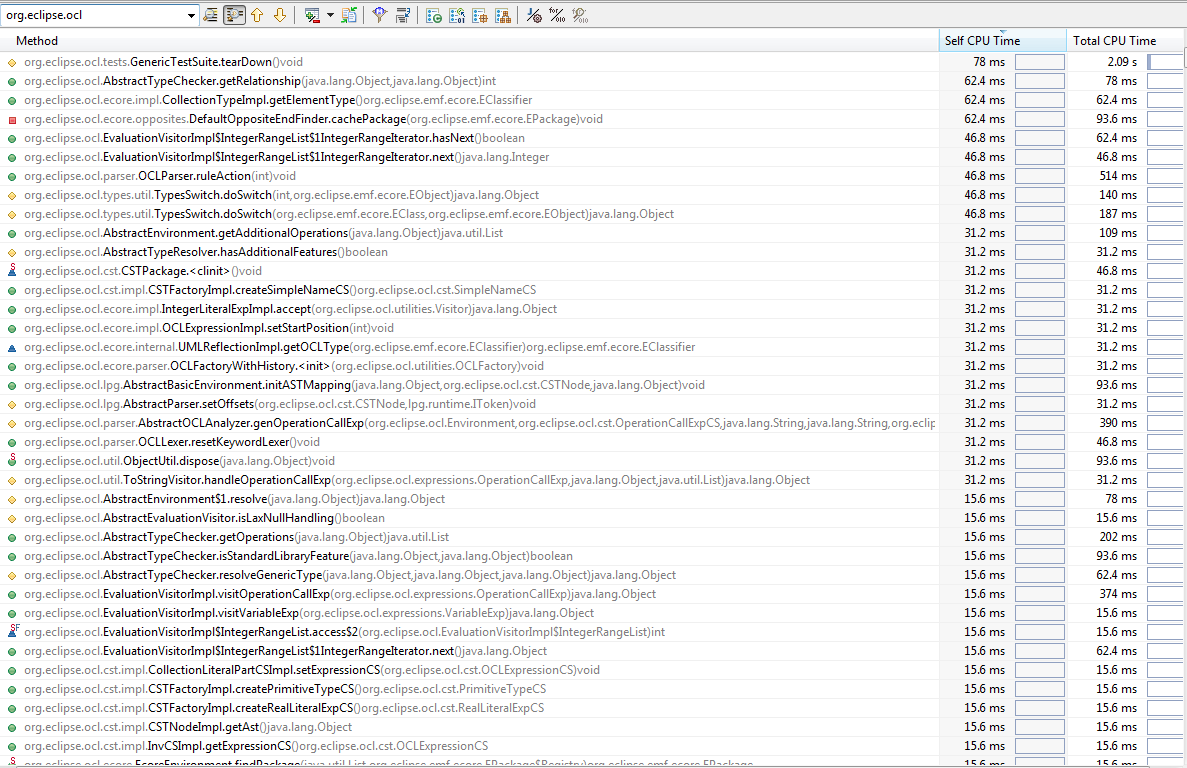
I found the IntegerRangeIterator.hasNext() cost surprising, so I
drilled in:
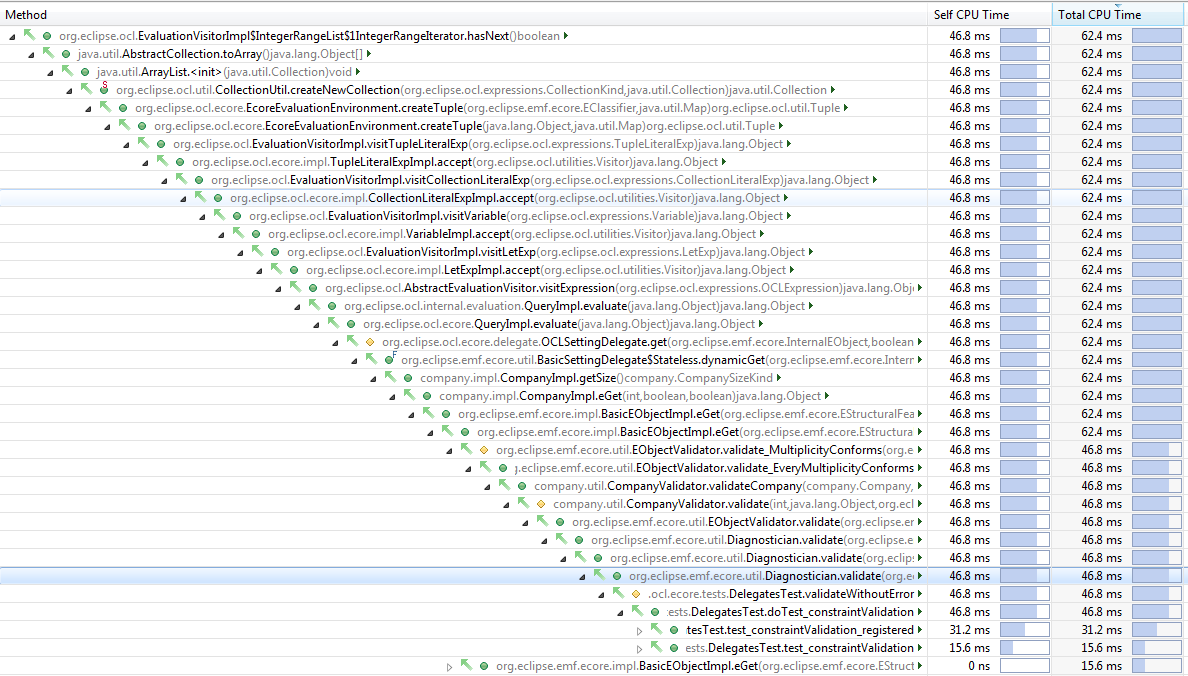
(Don't ask me why the Self CPU Times stay the same for so many
parent calls and why the Total CPU Times are decreasing rather than
increasing; I suppose a bug in the profiler plug-in....)
Here are the numbers by decreasing Total CPU Time:
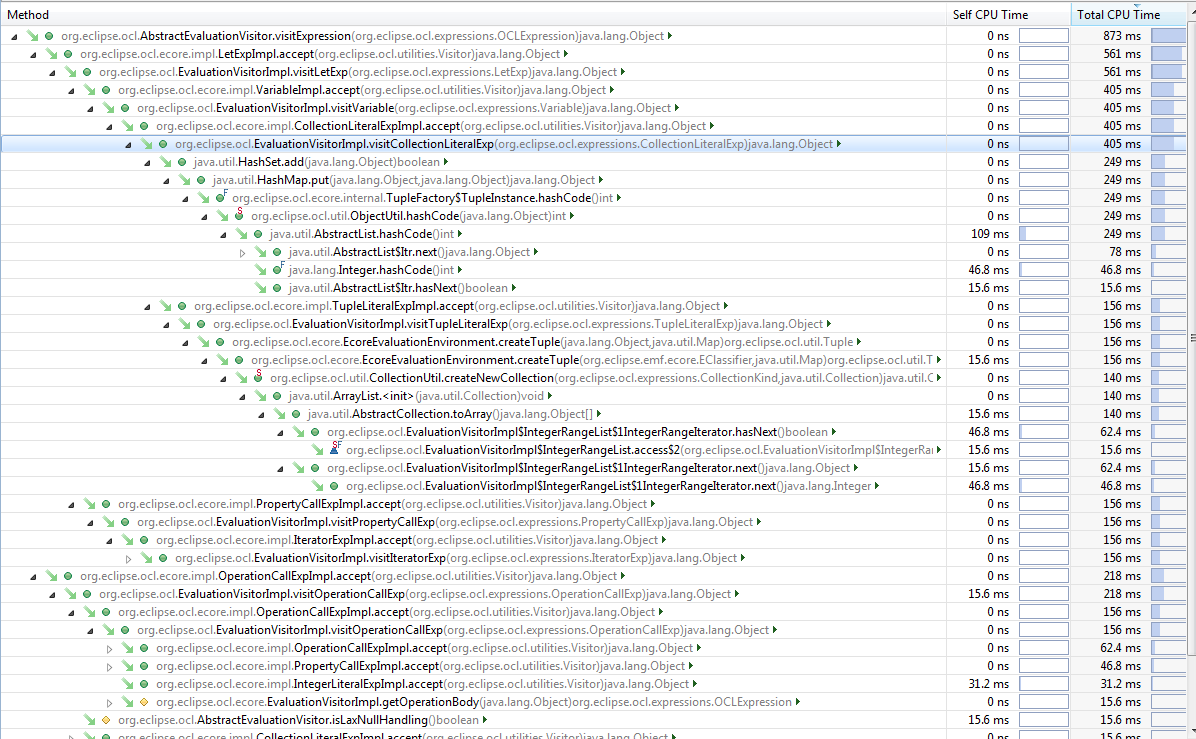
Self-Time seems to be fairly evenly distributed. Exceptions are
AbstractList.hashCode with 109ms self time which is called for
computing a tuple instance's hash code, and again the
IntegerRangeIterator.hasNext/next calls already identified
previously.
I derive from this two suggestions:
1) We can try to accelerate execution by using switch(...) based on
Ecore feature IDs instead of polymorphic visitor dispatching and see
how much that gains.
2) We can try to improve specific bottlenecks such as the tuple
hash code computation (easily solvable by caching the constant
tuple's hash code once computed), as well as the tuple creation
process which seems to spend more time than seems appropriate for
cloningi an IntegerRange which, as an immutable object itself, could
just be referenced instead of copied in this case.
If anyone's interested, I can suggest a patch for 2) which seems
very straightforward and can certainly even go into Indigo. 1) seems
to require a larger restructuring of how the evaluator works and
should be thoroughly planned.
Comments?
Best,
-- Axel
|