Sorry for the late reply.
As for your question under here:
Q: " How do you control the context e.g. set
breakpoints etc? Would that go over a separate connection or would you try
tunnelling all debugger requests through your agent?"
A: We have a agent on simulator, it runs over the combined
protocol which defined by ourselves, and can be ported to the device. it
takes all the responsibility of the the channel communication, and dispatch the
data to the right service implementation, transfer the result to the
host. So as for the debug, I think we must use the DSF, not just the existed
CDT CDI interface, because the CDI interface does not meet these needs.
I have read every mail list content since two years ago, I
noticed that , more and more people, ask the similar question: "how to combined
CDT, Launching Framework, TM, and Debug together to run properly".
Our solution to this question is to abstract the debug as a subsystem
of TM. And subsystem contains debug service. And if every
connection has contained the debug subsystem, launch the it's service.
And I also noticed another mail "Guide
to connect MIPS/ RISC using TM" ,you said that "To give you a concrete example of what can be done, Wind
River is commercially implementing a "WR Debugger Subsystem" (impl of
RSE ISubSystem) which can connect to multiple kinds of backend including
VxWorks agent, Linux usermode-agent, Generic gdbserver (can be OS or OS-less)
and Wind River ICE targets (without any OS)." .
so
I think we are doing the same thing.
"
Best regards.
发件人: Oberhuber, Martin
[mailto:Martin.Oberhuber@xxxxxxxxxxxxx]
发送时间: 2007年1月24
日 15:59
收件人: Target Management
developer discussions
主题: RE: [dsdp-tm-dev] TM
& Debug Service
Hello Jingxiong,
One important point of your design seems to be the multiplexing of
the various services on a single, replaceable connection.
The ISimulatorDebugService you outline contains method for
launching a debugger, and it seems to make use of other registered services
(like shell, download etc) to perform its actions. Up to now, nobody that I'd
know of has tried such an approach, but it seems to make some sense. The
approaches that I know would directly use IHostShell, IShelLService,
IFileService etc. in the ILaunchConfigurationDelegate and I'm not sure I can
see the benefit of abstracting an ISimulatorDebugService just for launching.
What I do not quite understand, is how your debugger would continue operation
once the remote context is launched. How do you control the context e.g. set
breakpoints etc? Would that go over a separate connection or would you try
tunnelling all debugger requests through your agent?
In some previous face-to-face meetings, we have been discussing
ideas of abstracting the actual debugger implementation (with abstract actions
like singleStep, runTo, setBreakpoint etc that can be implemented differently
by different debuggers). The device debugging project continues going that
route with the Debugger Services Framework (DSF). For target management, we do
not see these abstractions right now since they are too debugger centric. We
see target management more as the mediator that allows discovering kinds of
services which may be implemented by others.
That being said, tunnelling of arbitrary connections through a
single multiplexed channel is an important use case for target management that
has come up in several scenarios so far. We have not done any analysis or
design work for that use case so far but it looks like we'll need to consider
it for the future.
Regarding the Launch Action idea from my presentation, there's
currently some interesting discussion on this list with Robert Norton. Feel
free to join if you are interested.
Hope this helps - let us know if you have more questions.
Thanks,
Martin Oberhuber
Target Management Project Lead, DSDP PMC Member
From:
dsdp-tm-dev-bounces@xxxxxxxxxxx [mailto:
dsdp-tm-dev-bounces@xxxxxxxxxxx] On
Behalf Of jingxiong chen
Sent: Tuesday, January 23, 2007 8:22 AM
To: dsdp-tm-dev@xxxxxxxxxxx
Subject: RE: [dsdp-tm-dev] TM & Debug Service
Hi, Martin,
Thanks for your help
and advices!
What I most worry
about is that taking debug as a service above the RSE(TM) is the right way ?
Has anyone ever tried that?
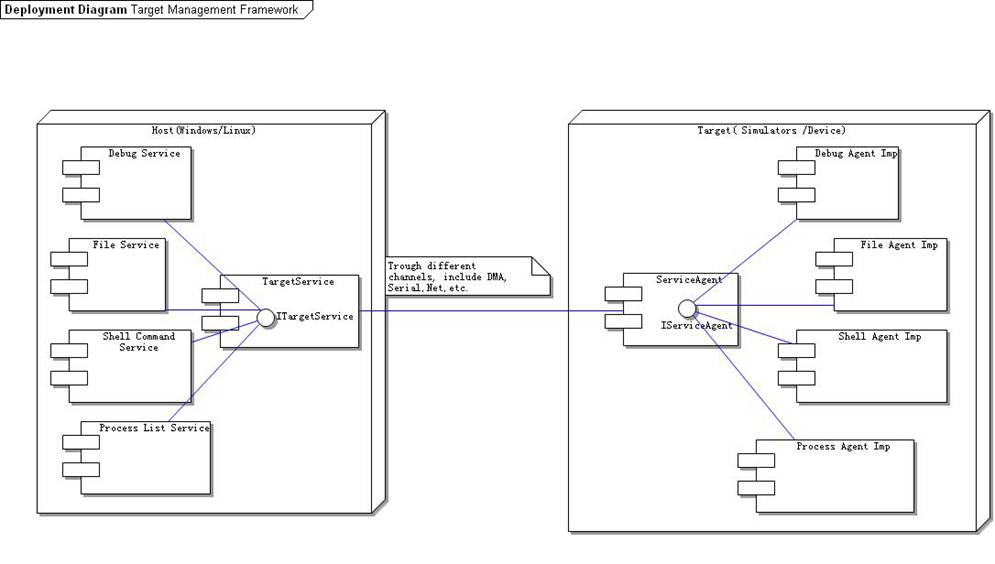
Here is the
Framework Diagram and Class Diagram for the Simulator, and Simulator
debug Service Diagram with the discription.
1、 Target Management Framework
2、 the Simulator Debug Service Class
Diagram
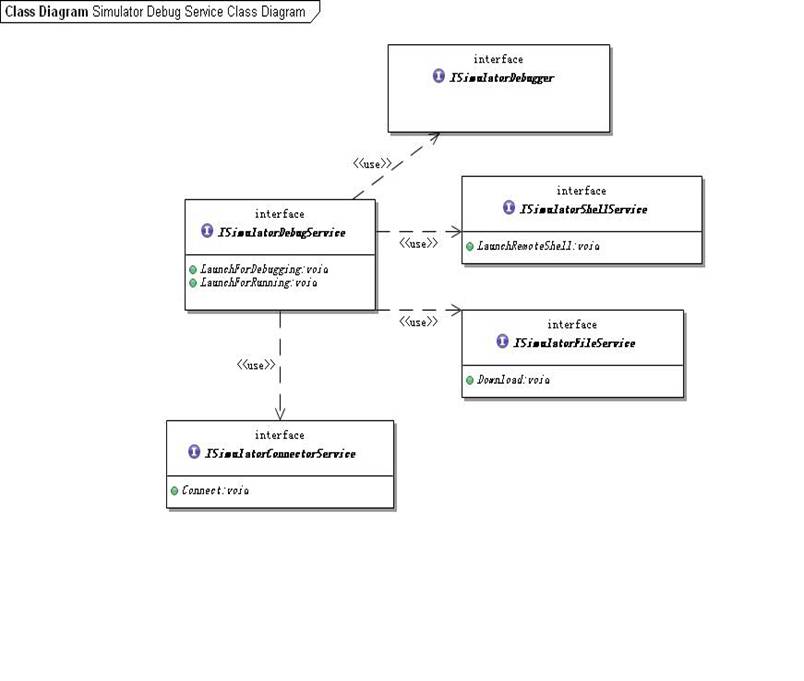
Description:
Here we take simulator connection as an example. We have a agent on simulator
which provide the service such as debug, process. Look at the debug service
agent, it works just like gdbserver/gdbstub.
When the IDE
user select a connection from LaunchConfiguration UI Component,
and want to debug an application on it, LaunchConfigurationDelegate
will try to find out if this connection has the IDebugService interface. if
yes, launch the method LanchForDebugging . and the
LaunchForDebugging method has a sequence to take response to check ,
download , and launch the program on the selected connection. and then , Use
the Debugger to take control of the remote running process .
the ISimulatorDebugger is inherited and modified from
ICDIDebugger2.
I have also studied the ppt you written "Component Based Launching (Launch
Actions)" . you said that "There is a need for "scripts" to
execute such complex launches". and I totally agree with you.
Indeed I implement such "script" as java code.
发件人: Oberhuber, Martin [mailto:
Martin.Oberhuber@xxxxxxxxxxxxx]
发送时间: 2007年1月19
日 16:59
收件人: Target Management
developer discussions
主题: RE: [dsdp-tm-dev] TM
& Debug Service
Hello Jingxion,
Your approach sounds
perfectly reasonable.
I'd probably use much
fewer plugins for what you're trying to
accomplish, since I
don't quite see the value of such plugin
separation but it slows
down Eclipse startup if you have too
many plugins. For RSE
itself, we're also working towards
reducing the number of
plugins. For you, I'd rather choose
com.***.tm.debug.[core,ui] for the core debug service which you may
use for either simulator or other agents
com.***.tm.simulator.[core.ui]
for the simulator.
But, if you already
defined the plugins of course you can live
with this for now -- lumping
them together at a later point is
always easier than
splitting it up later on, so you could keep
them separate until you
see any issues (performance or other).
I'm not sure what kind
of functionality your debug subsystem
would provide to the TM
/ RSE view. Sketching out the interface
of your IDebugService
would probably help me to understand.
"Perform the
debugging operation" is not sufficient for me to
With respect to
Examples, we currently have the tutorial "team
subsystem"
example, can you be more specific about your
needs? The problem with
tutorial examples is that they need
to be self-contained
and/or use open source technology that's
readily available for
everybody. Most other debugging solutions
are proprietary. Do you
have an idea how your specific needs
could translate into an
example that can be ran by everybody?
Thanks,
--
Martin Oberhuber
Wind River Systems, Inc.
Target Management Project Lead, DSDP PMC Member
http://www.eclipse.org/dsdp/tm
From:
dsdp-tm-dev-bounces@xxxxxxxxxxx
[mailto:
dsdp-tm-dev-bounces@xxxxxxxxxxx] On Behalf Of Jingxiong Chen
Sent: Friday, January 19, 2007 3:35 AM
To: dsdp-tm-dev@xxxxxxxxxxx
Subject: [dsdp-tm-dev] TM & Debug Service
Hi All,
We are
integrating RSE as our Target Management Solution.
We have an
"Target Agent" on Simulator and, also the Target board. This
Agent Provides kinds of connective functionalities and debug services for the
Host tools.
Concerning
about the Debug service, we decided to introduce the debug service as IDebugServiceSubSystem
in RSE. In the LaunchDelegrate, we use the IHost to find out if the
connection has the IDebugServiceSubSystem, and then use
IDebugServiceSubSystem.Connect() to perform the connecting operation, after
that, we use the IDebugService.debug() which provided by the
IDebugServiceSubSystem to perform the debugging operation.
Here are
the plugins we extend the RSE:
Com.***.tm.services.debug : the service Interface of debug service.
Com.***.tm.subsystem.debug.core: the subsystem interface and abstract
implement of the debug subsystem.
Com.***.tm.subsystem.debug.ui: the default subsystem ui imp
Simulator
Com.***.tm.connectorservice.simulator:
the connector service of the simulator
Com.***.tm.services.simulator
: all the services provided by simulator including processlist, shell,and
debug.
Com.***.tm.simulator : extends
the systemTypes extension point.
Com.***.tm.subsystem.files.simulator:
the file service for simulator
Com.***.tm.subsystem.process.simluator:
the process list service for simulator.
Com.***.tm.subsystem.shell.simulator:
the shell service for simulator.
Com.***.tm.subsystem.debug.simluator:
the debug service for simlulator.
Com.**.debug , Com.***.debug.ui
: these plugins provides the implement of the debugger, and called by the
"subsystem.debug.core" plugin.
I am
wondering if this is the right way to use RSE? Can anyone point out the faults
for us? Thanks!
Hi Martin, do you have any
plan to provide some sample plugins to demonstrate such kind of questions faced
by the RSE integrators? I have studied the remote CDT sample, but it
don't seem to meet our needs , we want to encapsulate "how to launch the
debug service though all kinds of connections", not to explicitly use the
shellCommands such as remotecdt sample do.
Thanks Martin and all.
Jingxiong Chen