[Date Prev][Date Next][Thread Prev][Thread Next][Date Index][Thread Index] [List Home]
[corona-dev] Visual representation of a graph.

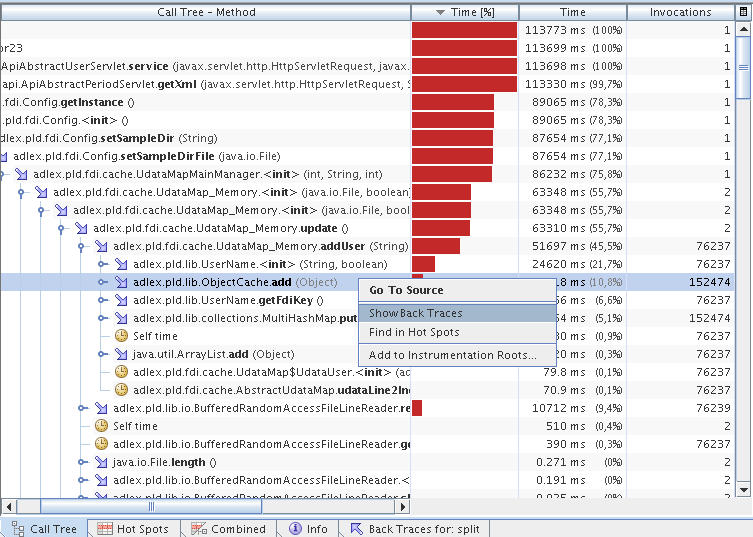
I've seen some solution for this in Netbeans Profiler. As you profile an application you can find hotspots in two ways - one is to go through stack trace and find methods that take most time. It is quite natural, if there is one inefficient method. This view is shown in "graph_tree.png".

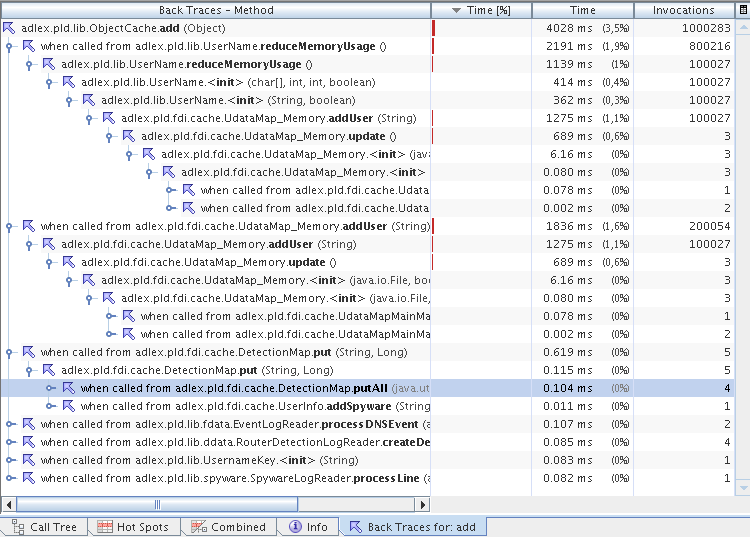
But, sometimes there are some inefficient methods that are invoked in many places. A single invocation it isn't expensive, so you would skip it in a drill down view, but in summary it takes a lot of time. If we spot such method, we would like to see all traces that lead to it, and at least fix the critical path. This view is shown in "graph_reverse_tree.png". To get this view, you need to click "show back trace" in context menu of a method (in any view, eg. hotspots, call tree). The selected method becomes a root of the reverse tree.

This defenitely do not provide a full graph structure, but at least gives some idea about it. We could consider it.

Marcin
The contents of this e-mail are intended for the named addressee only. It contains information that may be confidential. Unless you are the named addressee or an authorized designee, you may not copy or use it, or disclose it to anyone else. If you received it in error please notify us immediately and then destroy it.

PNG image

PNG image


Back to the top