Hi,
I work for Texas Instruments. I am in the process of
migrating the breakpoint feature of our non GDB debugger from CDT to DSF. I am
wondering if the breakpoint feature of our debugger is common with other
debuggers. If that is the case I am willing to design and contribute a solution
that fits these debuggers as well.
Our debugger is capable of creating different breakpoint
types - software line breakpoint, hardware line breakpoint, watchpoint, event
breakpoint, counter, DMA transfer, stack overflow, trace, etc… Each
device can support different breakpoint types. Furthermore, until a connection
to the device is established, the supported types are unknown.
The backend generates the list of breakpoint properties
dynamically base on the breakpoint type and the device type. Even for the same
breakpoint type, the list of breakpoint properties can be different base on the
device: hardware breakpoint on a MCU has a different list of properties than a
DSP hardware breakpoint.
In our current product, this is how we presented this
backend feature.
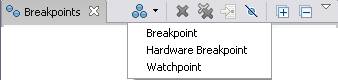
Due to the dynamic nature of the breakpoint types in our
backend, we need a way to list all available breakpoint types for the current
debug device. We added the toolbar action to the breakpoints view:
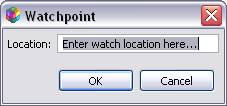
Selecting a menu items will prompt the user to specify
initial properties for the new breakpoint. This is an example of the dialog for
creating a watchpoint:
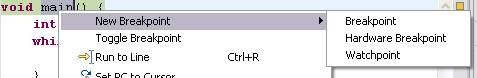
The backend can specify if a breakpoint type is applicable
to a specific view: c-editor, asm-editor, disassembly view, C/C++ project,
outline view. These types will be displayed as a context sub menu in these
views:
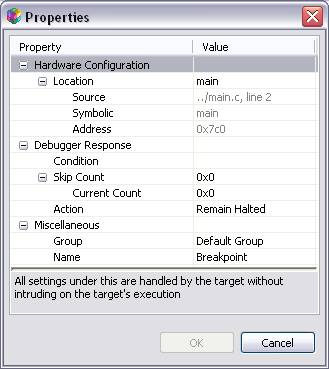
The layout of the breakpoint properties is controlled by the
backend. We decided a property sheet is most suitable to edit the property
values:
Is this something that people would be interested for me to
contribute?
Thanks in advanced,
Patrick