Yes, thanks! This is exactly what I
needed.
What is the right way to define
drill-through behavior for each stack on this chart? Can this be done just by
using the visual designer or I have to use scripting?
From: Heng Li
[mailto:heng.li@xxxxxxxxxxx]
Sent: Wednesday, August 01, 2007
8:19 PM
To: Alec Lebedev
Subject: RE: [birt-news] problems
with stacked bar chart
Do you want the chart looks like this?
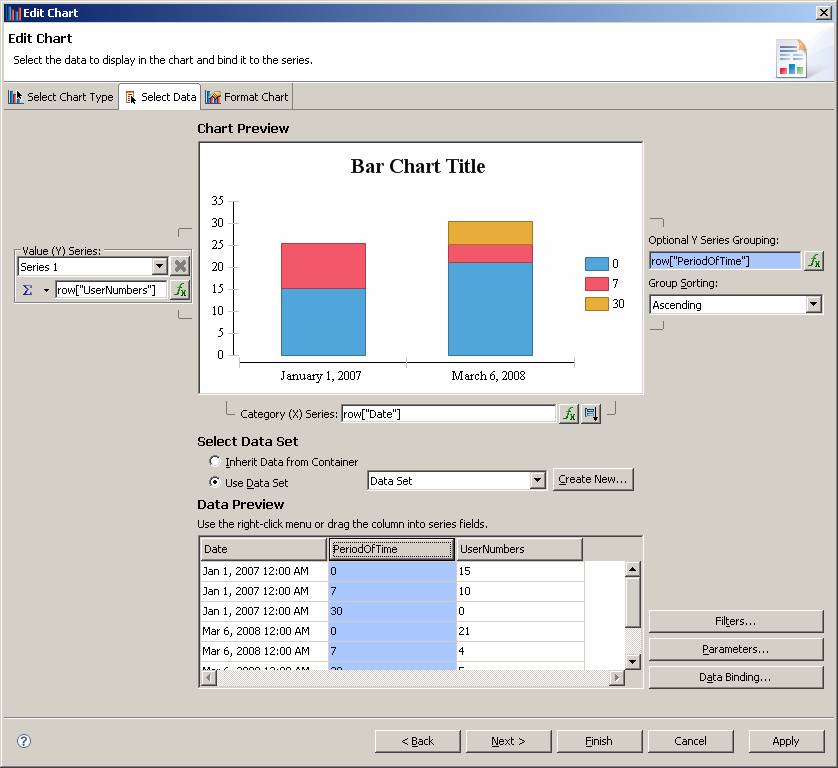
You can set period of time as Y series
grouping and enable X series grouping.
Henry Li
Actuate Software (Shanghai, China)
Co., Ltd.
(: (86)21-58826388
*: heng.li@actuate.com
From:
birt-news-bounces@xxxxxxxxxxx [mailto:birt-news-bounces@xxxxxxxxxxx] On Behalf Of Alec Lebedev
Sent: Thursday, August 02, 2007
8:08 AM
To: birt-news@xxxxxxxxxxx
Subject: [birt-news] problems with
stacked bar chart
I have the following data set, which lists the date, the
period of time, and the number of users that were inactive within that period
of time on that date.
01/01/2007 0 15
01/01/2007 7 10
01/01/2007 30 0
15/06/2007 0 21
15/06/2007 7 4
15/06/2007 30 5
I would like to build a stacked bar chart, which has one bar
per distinct date (first column) and one stack per distinct period of time
(second column). Each stack’s height will be set to the number of users
(third column).
So, for the data set above I would have two bars: one
– for 01/01/2007 and another one for 15/06/2007. The first bar will have
three stacks on heights 15, 7 and 30. The second bar will also have three
stacks with heights 21, 4 and 5.
I can map X-series to the first column, but I don’t
know how to map each Y series to the corresponding period of time. In other
words, I want one Y-series to be mapped to rows with interval=0, another series
– to rows with interval = 7 and the last series – to rows with
interval=30.
How should I define expressions for those series in
_expression_ Builder?
Thanks.
Alec