|
Report writing creates an expensive bottleneck for
many companies because it demands ongoing, iterative involvement from
in-house developers. This white paper describes a novel approach to report
writing which allows business users to layout elegant reports using
Microsoft Word as the layout tool.
Introduction
Report writing is costly and time consuming. The people who need
the reports -- business users -- generally can't create them without the
help of a programmer or developer. Creating reports becomes an iterative
process. The business user enlists the developer's help. The developer
creates a report and shows it to the business user. With feedback from the
user, the developer then refines the report. This process happens for
reports across the organization.
IT and business resources get tied up in this time-consuming
process. Plus, report writing is often the lowest priority for developers
because they are under pressure to deliver revenue-generating products.
This endless report design process is very slow, expensive and
frustrating for all departments involved. Worse still, the final report
created is inadequate -- getting it right becomes too expensive and takes
too much time.
What if report design were easy enough that program managers,
product managers, accounting managers or any business user could do it
alone, without help? What if there were no ad hoc query tools or complex
report writers that require programming knowledge? What if there was no
learning curve?
Windward Reports - for simplified report writing
Microsoft Word (or any other word processor) is the key to a new
and innovative approach to report writing called Windward Reports.
Microsoft Word is a powerful layout tool that almost everyone knows how to
use. Setting up tables and formatting text in Word is almost second nature
to most business people. Leveraging the familiar Word environment, business
users have an easy-to-use tool to create the sophisticated reports they
really want.
Business users can take full advantage of Word's formatting and
What-You-See-Is-What-You-Get environment. There's little or no learning
curve.
|
|
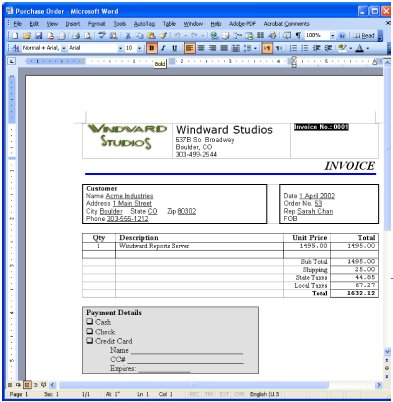
Figure 1
Purchase Order Template
Created and
Formatted in
Word
|
By the way, if you are looking for some report tool specific item
in figure 1, there isn't anything. Figure 1 is a plain old Word document
report. Everything you would do to create a similar report template you
already know how to do.
Windward Reports is an enterprise-level reporting engine that uses
Microsoft Word, or any other word processor such as Open Office, to design
a report template. Windward Reports takes the template you design and any
number of data sources (such as xml or sql databases) and merges them
together to create your final report.
Using Windward Reports
Windward Reports design platform can be called by java or .NET
programs, either directly or in a client server configuration.
Windward Reports includes AutoTag®, an add-in for Microsoft Word
which greatly simplifies data layout and data source mapping, eliminating
the expense and frustration of the iterative report development process.
Because the report is designed in Word, business users can design it
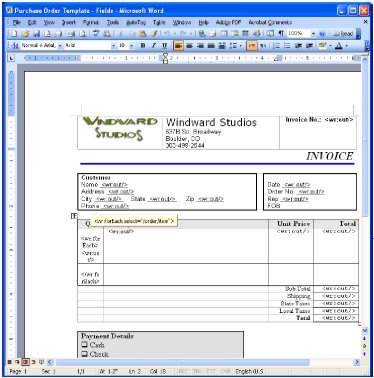
correctly and quickly. Figure 2 shows a Purchase Order Template that was
created in Word using AutoTag:
|
|
Figure 2
Sample Purchase
Order with
AutoTag
|
Tags are added to the template to indicate where data will be merged
into the template to create the final report. The simplest tag is the out
tag, whose format is <wr:out select='/root/name'/>. In this case, the
tag will be replaced with the name of the customer from the xml data merged
with the template. While the entire tag can appear in the template, AutoTag
displays just the tag name. Placing the cursor over the tag name pops up a
tooltip that displays the entire tag.
In addition, when using AutoTag, there is no mistyping of tags in
the template. A user selects "Insert Tag" from the drop-down menu
and a pop-up box displays the available tags. A business user can't get the
tag format wrong.
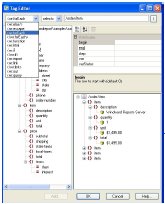
|
The Tag Editor makes it easy for a non
developer to:
- See the data nodes and select the one you want, easily
setting the tag to point to the correct data. There is no need to
understand how to access a database.
- Displays the data that the tag will return. This uses a
sample dataset and delivers immediate visual feedback of the data
that will be inserted.
|
|
Figure 3
Tag Editor
|
While there are 9 tags, most work is performed with two tags: the
out tag (described above), and the forEach tag. The forEach tag will loop through
a set of data, once for each row of data. In the screenshot above, the
forEach will loop through 4 times, once for each item in the invoice. In
the template displayed in Figure 3, it will create one row in the table for
each of the 4 items purchased.
Once the template is complete and the desired report output format
is chosen (PDF, RTF, HTML, WordML, XLS, SpreadsheetML, TXT, or multi-part
MIME email), Windward Reports merges the template with the corresponding
report data. The result is a finished report with all the formatting and
positioning specified by the business user - available in minutes.
Proven Efficiency
Windward Reports' customers attest to this ease of use and time
savings:
Mr. S.S. Mohanty of Nucleus Software Exports, says
his favorite feature of Windward Reports is the Word based template because
it made his life easier. Prior to using Windward Reports, he said "I [previously] spent
half my time designing and scripting reports to meet the Bank's
requirements. With Windward, we can layout a report in Word and get
immediate approval from the client."
Mr. Bjerregaard Pedersen of Backbone Digital
Systems said "compared
to systems where both layout and data must be coded, as we did before, the
process of creating a new report is at least 5 times faster."
|