PPS : heat maps would be nice too:
Meilleures salutations / kind regards / Mit freundlichen Grüssen,
___________________________
Patrick Cornaz
ReportingSoft S.A.
Office: +41 (0)21 791 5487
Cell : +41 (0)79 753 8154
De : birt-dev <birt-dev-bounces@xxxxxxxxxxx>
De la part de Patrick Cornaz
Envoyé : jeudi, 2 mars 2023 11:17
À : For developers on the BIRT project <birt-dev@xxxxxxxxxxx>
Objet : Re: [birt-dev] better graphics
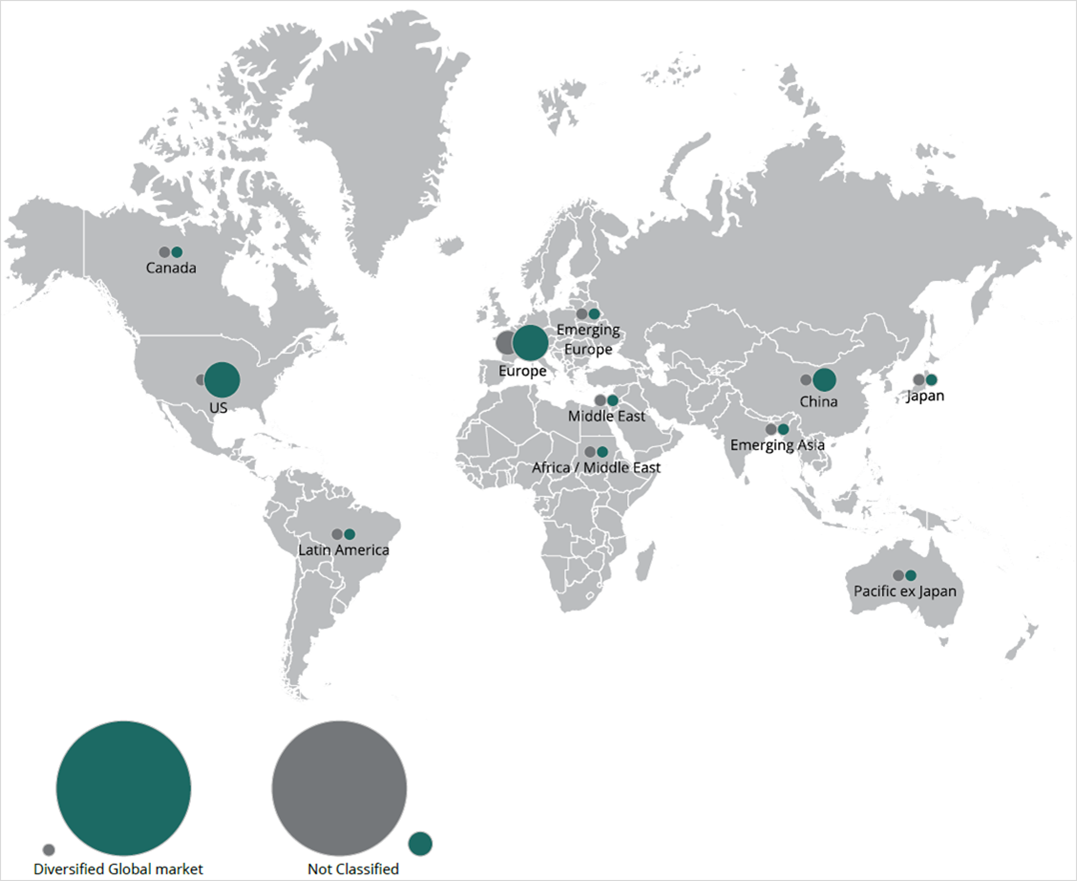
PS: here an example of a multi-series map chart which we had to code “by hand” in Java + SVG, and which would be nice to get “out of the box” in BIRT:
Meilleures salutations / kind regards / Mit freundlichen Grüssen,
___________________________
Patrick Cornaz
ReportingSoft S.A.
Office: +41 (0)21 791 5487
Cell : +41 (0)79 753 8154
I'll add that indeed, if you are aiming at generating high end paper / PDF reports, if you get a graphical designer's input and spend time setting all the properties + write a few scripts to recalculate some of them dynamically based on
the data (like the axis labels and the legend), then you can get some really slick charts out.
Still, the addition of 2-3 modern chart types like a map, I mean a geographical one, for example, would be nice.
Meilleures salutations / Kind regards,
-------- Message d'origine --------
Date : 02.03.23 00:57 (GMT+01:00)
Objet : Re: [birt-dev] better graphics
Based on many years using open source and commercial library:
1. The SVG option, when available, addresses the “resolution” problem. It create pdf (and may be HTML, did not try) that looks great at any resolution, including zoom.
2. Problem with both svg and png is that they are created for fixed aspect ratio. Works ok if the output is pdf or page like. Does not work well to when using mobile devices, or resized windows - the XY ratio is fixed at generation time. Also, svg does not
address well the need to keep fonts at readable size (e.g. 8-10 points) to attach labels to chart elements at fixed font size.
3. Major issue with almost all server side libraries is that they have fallen behind Client side libraries. State of the art, best looking libraries nowadays are generating svg graphics with typescript/_javascript_. The charts generated by Birt charting (and
most open source server side) looks outdated, I would even say “boring”.
4. Users expect charts to be responsive, react to mouse overs, provide some animation, etc, server side charting usually not able to provide those.
Bottom line : built in charting is good for “static” reports - there are many good use cases for that, but they are many other use cases, especially for HTML reports/dashboard where “flashy” charts are expected.
Yair
Sent from my iPad
_______________________________________________
birt-dev mailing list
birt-dev@xxxxxxxxxxx
To unsubscribe from this list, visit
https://www.eclipse.org/mailman/listinfo/birt-dev
|