[
Date Prev][
Date Next][
Thread Prev][
Thread Next][
Date Index][
Thread Index]
[
List Home]
|
[birt-charting-dev] Problems with two series definitions and stacked area charts
|
Hello,
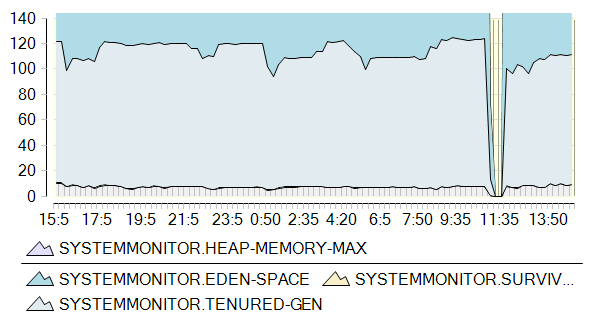
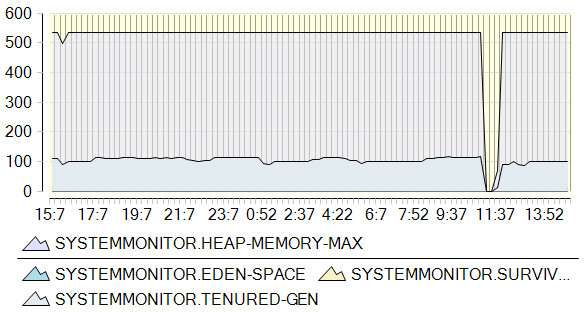
I have a problem with multiple series definitions for the Y-axis (in SWT
if this matters). The chart should display four data series, series 1-3
should be stacked area charts and 4 not stacked. The display order
should be 4, 1, 2, 3 (from the background to the foreground, values in 4
are always larger than the stacked ones for 1-3). Currently I have two
series definitions, the first one with series 4 and the second one with
series 1-3. As long a I do not stack any series everything works fine
but as soon as adding setStacked(true) for the series 1- 3 two problems
occur. First, the maximum calculation for the Y-axis does not work
anymore, the stacked series 1-4 are visible but the vlaues of series 4
are drawn outside of the charting area. The second problem is that the
coloring and the legend do not match. The legend is fine (and the same
as in the unstacked case), but in the chart the series 2-4 are stacked
and series 1 is in the not stacked and also the colors are mixed up.
Thanks for your help,
hanno