Hi there,
We’re recently started a proof of concept of using AOP (AspectJ) in our existing product/project. At this time we have defined a single aspect file which contains ~9 pointcuts and ~ 8 join-points.. I think my terminology is correct
in saying we have mostly statically determined pointcuts. Right now the pointcuts do have lots of operators (mainly OR’s). Are these know to be less performant? The aspect lives in a framework JAR and projects which use this framework configure Eclipse with
the framework JAR in the Aspect path.
We’re encountering some performance problems weaving using AJDT in Eclipse and was hoping for some recommendations from this mailing list.
I’d categorize the performance problems as follows
- Execution Time
- Memory and hanging up Eclipse
In terms of “Execution Time” the weave process takes ~2.5 mins. Full output attached but here are snippets from AJDT trace
11:1:59 Timer event: 212035ms: Total time spent in AJBuilder.build() This is after initial startup
11:7:3 Timer event: 141006ms: Total time spent in AJBuilder.build() This is after subsequently doing a CLEAN build
11:2:23 Created 10404 markers in 11334 files
11:7:17 Created 10404 markers in 11334 files
Our eclipse project is large. It consists of 11334 types (files). Of these types we’re expecting that only types annotated with @Entity (~700 classes) would be weaved. But AJDT seems to report that 10404 makers are created and if
I search the generated bytecode 19228 class files (of 21058) have references to “org.aspectj” in the bytecode. However only the @Entity classes have the inner $AjcClosure classes so I’m guessing it is advising correctly. Inspecting the non @Entity bytecode
which does have references to “org.aspectj” it typically seems to be something like
org.aspectj.weaver.MethodDeclarationLineNumber: length = 0x8
Reading online this seems to be some form of debug information? So what we are seeing it is taking 2.5mins+ and potentially weaving more than it should. Our aspect does not / can not filter by package.. Does not filter by class name
(i.e. our Entity classes are not postfixed with Entity i.e. AccountEntity). Our eclipse setup right now intermingles @Entity classes with other code so we cannot in Eclipse specify an inpath of certain class folders. We are using compile time byte code weaving
so can’t use an aop.xml to filter.. So for now let’s assume re-organising the project is not an option where should be look for improving this performance? We are trying to target ~ 700 classes of ~12000 and targeting the classes by classes annotated with @Entity
and the aspect then advises various methods of that class. Is that execution time about right? Perhaps we need to tweak our pointcuts to skip over classes quicker?
In terms of 2) Memory usage and eclipse hanging up it’s been a bit of a struggle for developers in Eclipse.. We have incremental compilation enabled but waiting 2.5mins at times really kills productivity. On top of the wait time even
with eclipse.ini configured with lots of RAM and multiple VM tuning settings we often need to restart eclipse because
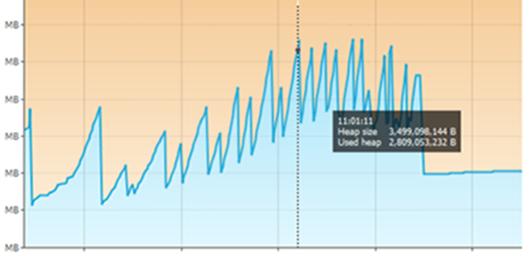
- It runs out of memory. Here are some graphics of the memory spikes for the executions above
First Execution
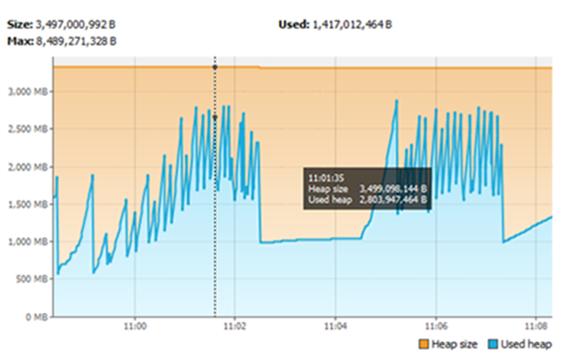
Second Execution (can still see first)
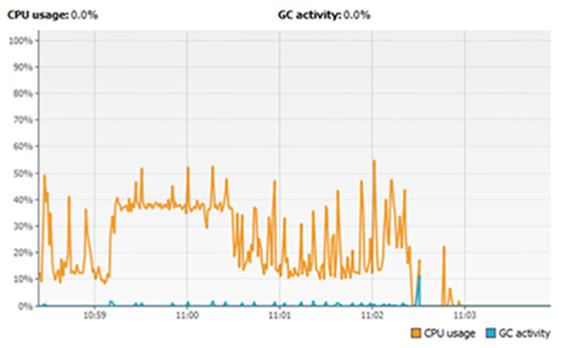
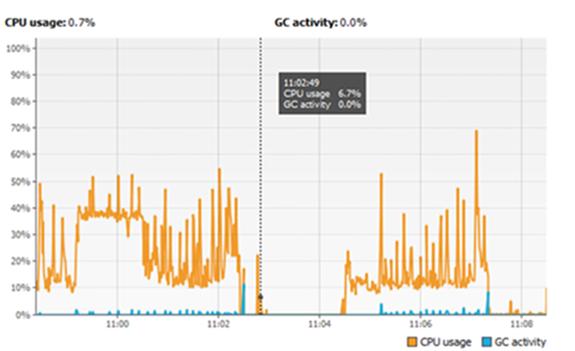
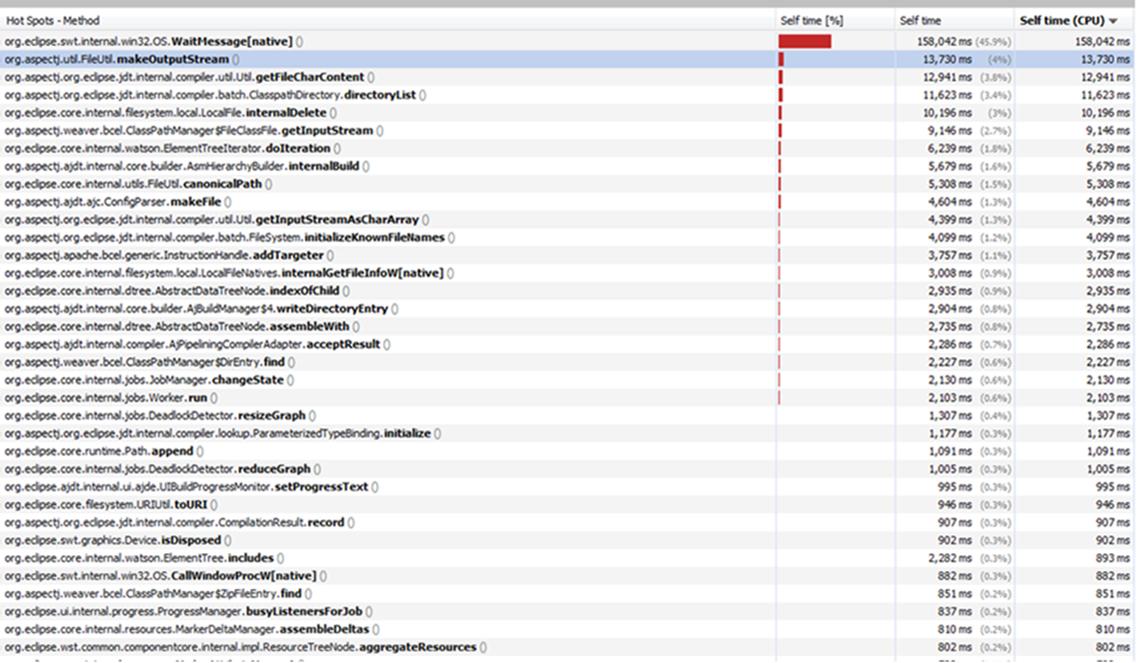
Profiling CPU using jvisualvm seems to be a pretty IO intensive operation (as expected)
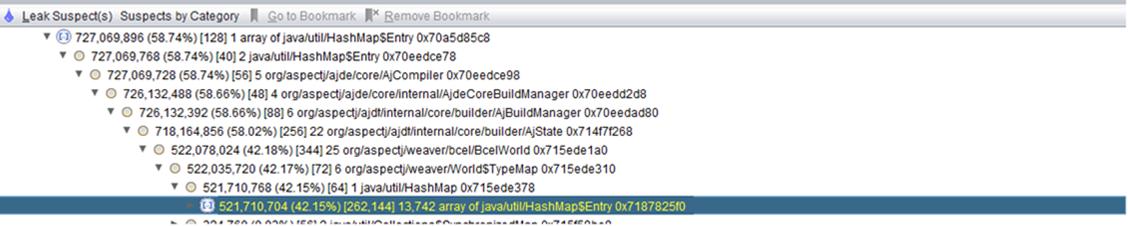
Here is a graphic of a heap dump I took at one point… Could there be a leak at play?
- Secondly on occasion the “Delete & Update markers” process will completely hang blocking other threads in Eclipse. It appears as if we’ve entered a loop of some sort.
Is it possible to turn off markers (or perhaps only install the weaver) and not take advantage of advise markers.
My Environment
- Windows 7, Oracle (Sun) JDK Java 7_45 64bit, 8GB RAM, i7 quad core processor
Here are some of the setting from eclipse.ini… Some of these have improved things somewhat
-Xms1024m
-Xmx4048m
-XX:MaxPermSize=512m
-Xverify:none
-XX:+UseG1GC
-XX:-DontCompileHugeMethods
-XX:MaxInlineSize=1024
-XX:FreqInlineSize=1024
-Xss1m
-XX:+UseCMSCompactAtFullCollection
-XX:+CMSClassUnloadingEnabled
-XX:+DoEscapeAnalysis
-XX:+UseCompressedOops
-XX:+AggressiveOpts
-XX:+ExplicitGCInvokesConcurrentAndUnloadsClasses
Any recommendations/advice would be greatly appreciated. Let me know if you need additional information.
Thanks
Rich