| Showing exception details while debugging [message #874947] |
Mon, 21 May 2012 20:57  |
 Alex O Alex O
Messages: 2
Registered: May 2012 |
Junior Member |
|
|
Hey, I have a problem which has vexed me for many days. It goes something like this:
I tell Eclipse to break on all uncaught exceptions, which it does do.
I run my code in debug mode.
Eclipse breaks on a RuntimeException, but the code it breaks on is not my code, and I do not have the source. I cannot step through, view, or watch any expressions in the code surrounding the place the exception is thrown at.
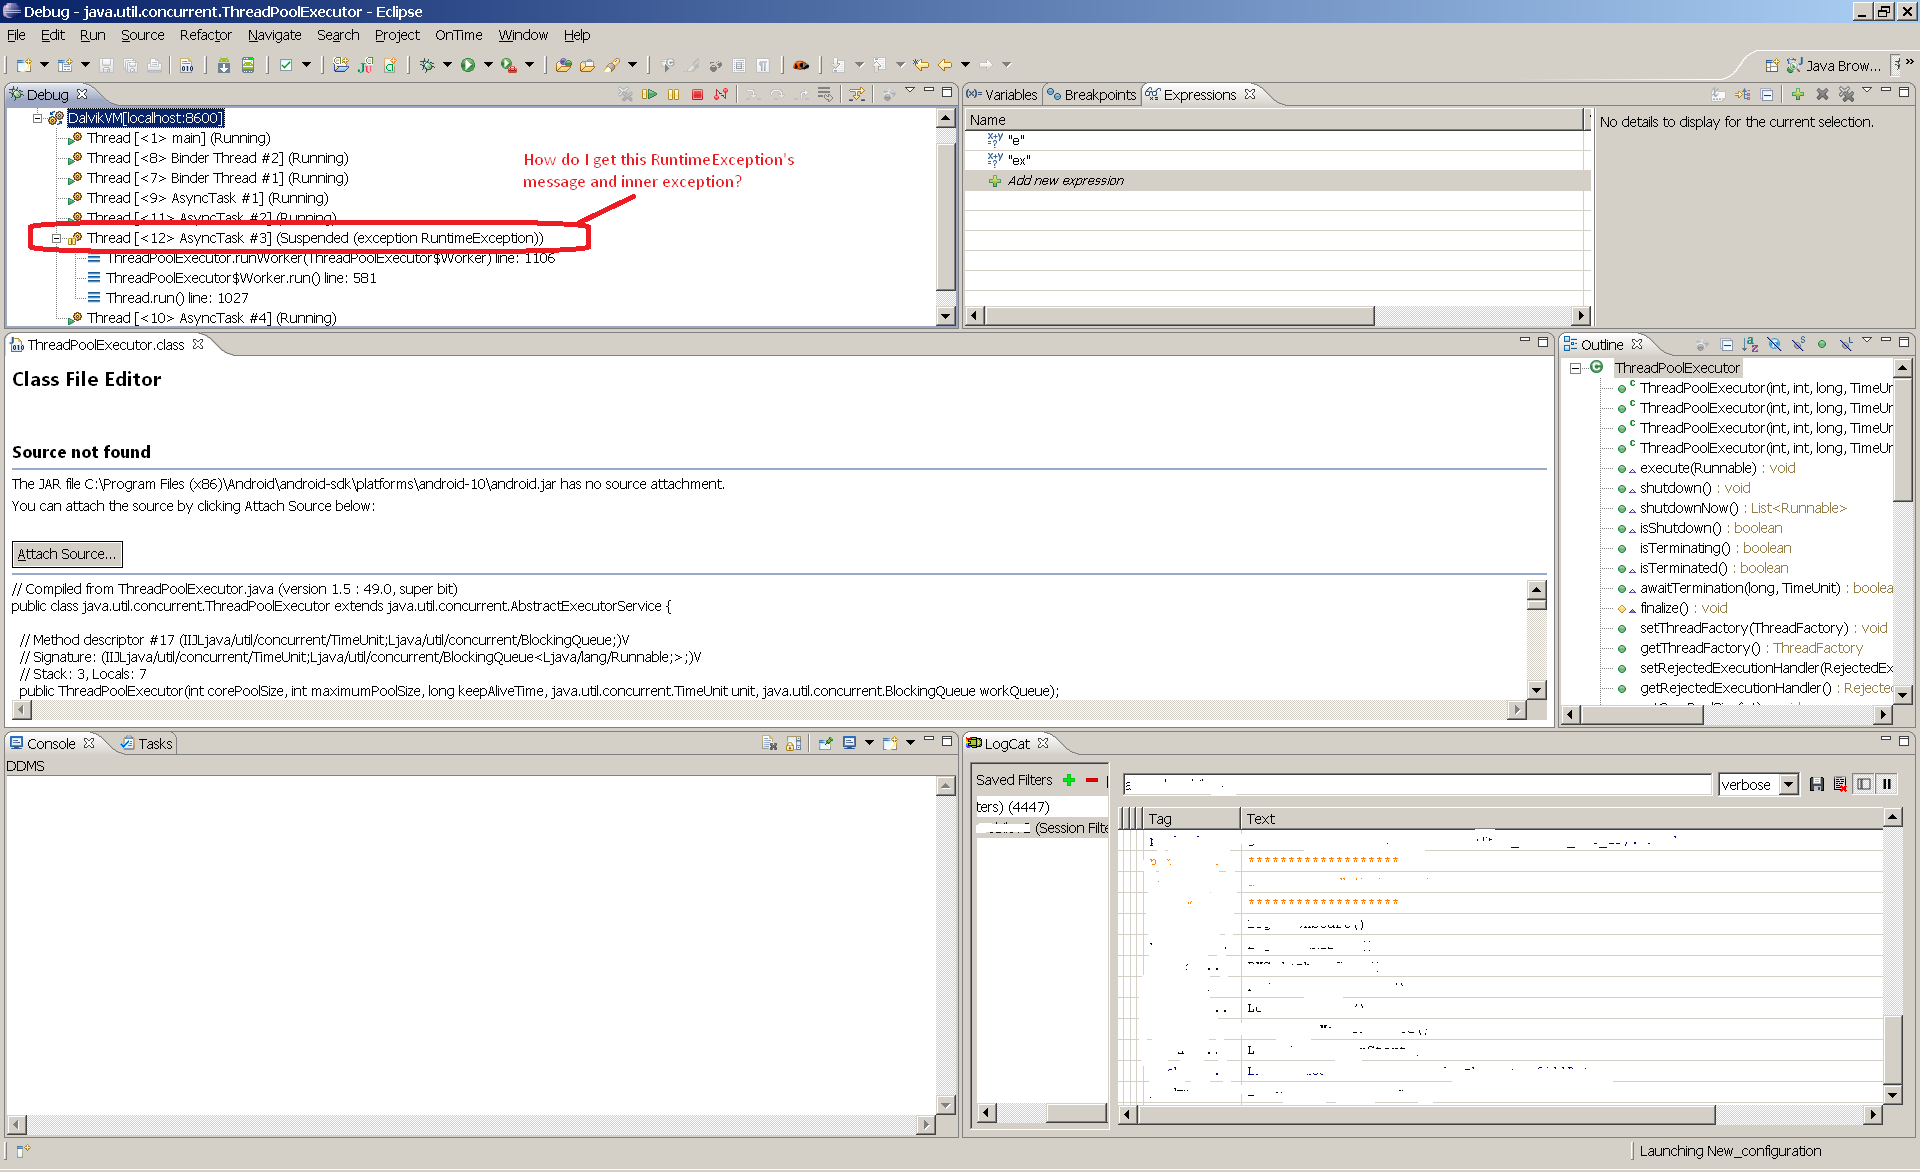
The debug window shows "Thread X is suspended (RuntimeException)", but I cannot view the exception (I can't see the message, the callstack trace, any inner exceptions, etc.) I would like to see these things, but I can't find any way of doing it. Right-clicking into the debug window doesn't give me anything useful, and hovering over any of the text in the window doesn't do anything either.
Anyone know how to place a watch on the exception object or at least view its message?
I'm attaching a screenshot of what I'm talking about.
PS.
I know about the special breakpoint for exceptions. Using it doesn't seem to change much. Breaking on the exception isn't the problem; trying to do anything useful with it afterwards is.
 Attachment: problem.png
(Size: 128.46KB, Downloaded 2319 times)
|
|
|
|
|
|
Powered by
FUDForum. Page generated in 0.02415 seconds
") ]
]  Search
 Help
Help Register
 Login
Login Home
Home


