Home » Archived » BIRT » Chart SDK 3.7.2 - suddenly my marker lines and colors gone?!
|
| Re: Chart SDK 3.7.2 - suddenly my marker lines and colors gone?! [message #808606 is a reply to message #808402] |
Tue, 28 February 2012 00:01   |
|
Can you hard code your MarkerLine using a NumberDataElementImpl as a
test? Like:
protected static final Chart createChart_Marker( )
{
ChartWithAxes cwaBar = ChartWithAxesImpl.create( );
Locale.setDefault( Locale.US );
cwaBar.setScript( "function beforeDrawMarkerLine(axis, line,
scriptContext)" //$NON-NLS-1$
+ "{ importPackage(Packages.java.util);" //$NON-NLS-1$
+ "if (scriptContext.getLocale().equals(Locale.US))" //$NON-NLS-1$
+ "{line.getLabel().getCaption( ).getColor().set( 165, 184, 55 );"
//$NON-NLS-1$
+ "line.getLineAttributes().getColor().set( 165, 184, 55 );}}"
//$NON-NLS-1$
+ "function beforeDrawMarkerRange(axis, range, scriptContext)"
//$NON-NLS-1$
+ "{range.getLabel().getCaption().getColor().set( 225, 104, 105
);}" //$NON-NLS-1$
);
// X-Axis
Axis xAxisPrimary = cwaBar.getPrimaryBaseAxes( )[0];
xAxisPrimary.setType( AxisType.TEXT_LITERAL );
xAxisPrimary.getOrigin( ).setType( IntersectionType.VALUE_LITERAL );
// Y-Axis
Axis yAxisPrimary = cwaBar.getPrimaryOrthogonalAxis( xAxisPrimary );
yAxisPrimary.getMajorGrid( ).setTickStyle( TickStyle.LEFT_LITERAL );
yAxisPrimary.setType( AxisType.LINEAR_LITERAL );
MarkerLine ml = MarkerLineImpl.create( yAxisPrimary,
NumberDataElementImpl.create( 2 ) );
yAxisPrimary.getMarkerLines( ).add( ml );
MarkerRange mr = MarkerRangeImpl.create( yAxisPrimary,
NumberDataElementImpl.create( 8 ),
NumberDataElementImpl.create( 12 ),
ColorDefinitionImpl.PINK( ) );
yAxisPrimary.getMarkerRanges( ).add( mr );
// Data Set
TextDataSet categoryValues = TextDataSetImpl.create( new String[]{
"Item 1", "Item 2", "Item 3"} ); //$NON-NLS-1$ //$NON-NLS-2$
//$NON-NLS-3$
NumberDataSet orthoValues = NumberDataSetImpl.create( new double[]{
8, 18, -15
} );
// X-Series
Series seCategory = SeriesImpl.create( );
seCategory.setDataSet( categoryValues );
SeriesDefinition sdX = SeriesDefinitionImpl.create( );
xAxisPrimary.getSeriesDefinitions( ).add( sdX );
sdX.getSeries( ).add( seCategory );
// Y-Series
BarSeries bs = (BarSeries) BarSeriesImpl.create( );
bs.setDataSet( orthoValues );
bs.getLabel( ).setVisible( true );
SeriesDefinition sdY = SeriesDefinitionImpl.create( );
yAxisPrimary.getSeriesDefinitions( ).add( sdY );
sdY.getSeries( ).add( bs );
return cwaBar;
}
Jason
On 2/27/2012 1:53 PM, Andreas Buchen wrote:
> Hi,
>
> just yesterday I switched my RCP project from the Chart SDK 3.7.1 to 3.7.2.
>
> No I am experiencing some differences in the line charts (the pie charts
> are okay), in particular
> * the marker lines are gone
> * the assigned colors are not used anymore
>
>
> First, the marker lines are not rendered anymore. This is how I do it:
>
> public LineChartBuilder addMarkerLine(Date date, ColorDefinition color,
> String label)
> {
> Axis xAxis = chart.getPrimaryBaseAxes()[0];
> MarkerLine ml = MarkerLineImpl.create(xAxis,
> DateTimeDataElementImpl.create(new CDateTime(date)));
> ml.getLineAttributes().setStyle(LineStyle.SOLID_LITERAL);
> ml.getLineAttributes().setColor(color);
> ml.setLabelAnchor(Anchor.SOUTH_EAST_LITERAL);
> ml.getLabel().getCaption().setValue(label);
> return this;
> }
>
>
>
> Second, the colors that I assign to the lines are not recognized anymore:
>
> private void addYLineSeries(ColorDefinition color, NumberDataSet dataSet)
> {
> LineSeries ls = (LineSeries) LineSeriesImpl.create();
> ls.setDataSet(dataSet);
> ls.setStacked(false);
> ls.getLineAttributes().setColor(color);
> ls.getLineAttributes().setThickness(3);
> ls.getLabel().setVisible(false);
>
> for (int i = 0; i < ls.getMarkers().size(); i++)
> ((Marker) ls.getMarkers().get(i)).setVisible(false);
>
> SeriesDefinition sdY = SeriesDefinitionImpl.create();
> sdY.getSeries().add(ls);
> yAxis.getSeriesDefinitions().add(sdY);
> }
>
>
>
> Any idea what changed between Chart SDK 3.7.1 and Chart SDK 3.7.2 and
> what I need to do to fix this?
>
> I appreciate any hint where to go looking.
>
> A.
>
>
|
|
|
| Re: Chart SDK 3.7.2 - suddenly my marker lines and colors gone?! [message #808947 is a reply to message #808606] |
Tue, 28 February 2012 10:14 |
 Andreas Buchen Andreas Buchen
Messages: 123
Registered: July 2009 |
Senior Member |
|
|
Hi Jason,
thanks for your answer. I appreciate your quick reply.
Your example runs fine within my program.
Then I adapted your example to demonstrate the two problems I have (see also attached screenshot). The full code is pasted below.
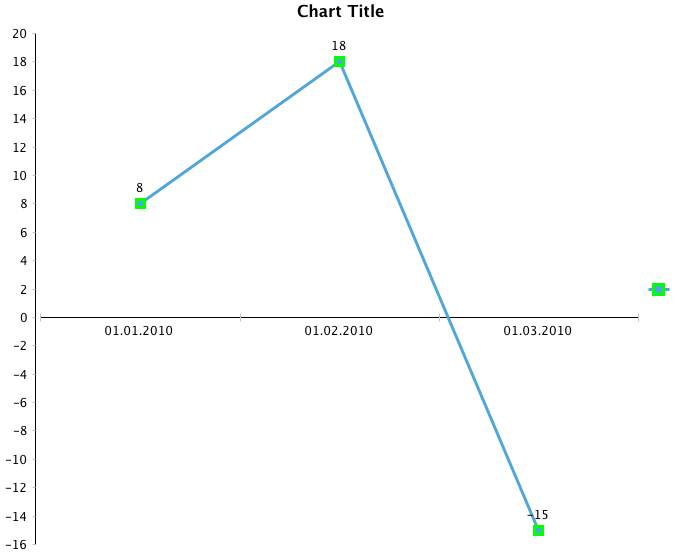
First, the marker lines are not shown.
        MarkerLine ml = MarkerLineImpl.create(xAxisPrimary, DateTimeDataElementImpl.create(new CDateTime(2010, 2, 1)));
        ml.getLineAttributes().setStyle(LineStyle.SOLID_LITERAL);
        ml.getLineAttributes().setColor(ColorDefinitionImpl.PINK());
        ml.getLabel().getCaption().setValue("Some marker");
        xAxisPrimary.getMarkerLines().add(ml);
Second, the line color stays blue (even though the line markers are green). Interesting, the thickness of the line can be changed, but not the color.
        ls.getLineAttributes().setColor(ColorDefinitionImpl.GREEN());
        ls.getLineAttributes().setThickness(3);
Any hints?
    protected static final Chart buildChart()
    {
        ChartWithAxes cwaBar = ChartWithAxesImpl.create();

        // X-Axis
        Axis xAxisPrimary = cwaBar.getPrimaryBaseAxes()[0];
        xAxisPrimary.setType(AxisType.DATE_TIME_LITERAL);
        xAxisPrimary.getOrigin().setType(IntersectionType.VALUE_LITERAL);

        // Y-Axis
        Axis yAxisPrimary = cwaBar.getPrimaryOrthogonalAxis(xAxisPrimary);
        yAxisPrimary.getMajorGrid().setTickStyle(TickStyle.LEFT_LITERAL);
        yAxisPrimary.setType(AxisType.LINEAR_LITERAL);

        // marker line
        MarkerLine ml = MarkerLineImpl.create(xAxisPrimary, DateTimeDataElementImpl.create(new CDateTime(2010, 2, 1)));
        ml.getLineAttributes().setStyle(LineStyle.SOLID_LITERAL);
        ml.getLineAttributes().setColor(ColorDefinitionImpl.PINK());
        ml.getLabel().getCaption().setValue("Some marker");
        xAxisPrimary.getMarkerLines().add(ml);

        // Data Set
        DateTimeDataSet categoryValues = DateTimeDataSetImpl.create(new CDateTime[] { new CDateTime(2010, 1, 1),
                        new CDateTime(2010, 2, 1), new CDateTime(2010, 3, 1) });

        NumberDataSet orthoValues = NumberDataSetImpl.create(new double[] { 8, 18, -15 });

        // X-Series
        Series seCategory = SeriesImpl.create();
        seCategory.setDataSet(categoryValues);

        SeriesDefinition sdX = SeriesDefinitionImpl.create();
        xAxisPrimary.getSeriesDefinitions().add(sdX);
        sdX.getSeries().add(seCategory);

        // Y-Series
        LineSeries ls = (LineSeries) LineSeriesImpl.create();
        ls.setDataSet(orthoValues);
        ls.setStacked(false);
        ls.getLineAttributes().setColor(ColorDefinitionImpl.GREEN());
        ls.getLineAttributes().setThickness(3);
        ls.getLabel().setVisible(true);

        SeriesDefinition sdY = SeriesDefinitionImpl.create();
        yAxisPrimary.getSeriesDefinitions().add(sdY);
        sdY.getSeries().add(ls);

        return cwaBar;
    }
|
|
|
| Re: Chart SDK 3.7.2 - suddenly my marker lines and colors gone?! [message #809574 is a reply to message #808947] |
Wed, 29 February 2012 02:23 |
|
Try adding:
xAxisPrimary.setCategoryAxis(false);
and
ls.setPaletteLineColor(false);
revised code below
protected static final Chart createChart_Marker( )
{
ChartWithAxes cwaBar = ChartWithAxesImpl.create();
// X-Axis
Axis xAxisPrimary = cwaBar.getPrimaryBaseAxes()[0];
xAxisPrimary.setType(AxisType.DATE_TIME_LITERAL);
xAxisPrimary.getOrigin().setType(IntersectionType.MIN_LITERAL);
xAxisPrimary.setCategoryAxis(false);
// Y-Axis
Axis yAxisPrimary = cwaBar.getPrimaryOrthogonalAxis(xAxisPrimary);
yAxisPrimary.getMajorGrid().setTickStyle(TickStyle.LEFT_LITERAL);
yAxisPrimary.setType(AxisType.LINEAR_LITERAL);
// marker line
MarkerLine ml = MarkerLineImpl.create(xAxisPrimary,
DateTimeDataElementImpl.create(new CDateTime(2010, 2, 1)));
ml.getLineAttributes().setStyle(LineStyle.SOLID_LITERAL);
ml.getLineAttributes().setColor(ColorDefinitionImpl.PINK());
ml.getLabel().getCaption().setValue("Some marker");
xAxisPrimary.getMarkerLines().add(ml);
// Data Set
DateTimeDataSet categoryValues = DateTimeDataSetImpl.create(new
CDateTime[] { new CDateTime(2010, 1, 1),
new CDateTime(2010, 2, 1), new CDateTime(2010,
3, 1) });
NumberDataSet orthoValues = NumberDataSetImpl.create(new
double[] { 8, 18, -15 });
// X-Series
Series seCategory = SeriesImpl.create();
seCategory.setDataSet(categoryValues);
SeriesDefinition sdX = SeriesDefinitionImpl.create();
xAxisPrimary.getSeriesDefinitions().add(sdX);
sdX.getSeries().add(seCategory);
// Y-Series
LineSeries ls = (LineSeries) LineSeriesImpl.create();
ls.setDataSet(orthoValues);
ls.setStacked(false);
ls.setPaletteLineColor(false);
ls.getLineAttributes().setColor(ColorDefinitionImpl.RED());
ls.getLineAttributes().setThickness(3);
ls.getLabel().setVisible(true);
SeriesDefinition sdY = SeriesDefinitionImpl.create();
yAxisPrimary.getSeriesDefinitions().add(sdY);
sdY.getSeries().add(ls);
return cwaBar;
}
Jason
On 2/28/2012 5:14 AM, Andreas Buchen wrote:
> Hi Jason,
>
> thanks for your answer. I appreciate your quick reply.
>
> Your example runs fine within my program.
>
> Then I adapted your example to demonstrate the two problems I have (see also attached screenshot). The full code is pasted below.
>
>
>
> First, the marker lines are not shown.
> MarkerLine ml = MarkerLineImpl.create(xAxisPrimary, DateTimeDataElementImpl.create(new CDateTime(2010, 2, 1)));
> ml.getLineAttributes().setStyle(LineStyle.SOLID_LITERAL);
> ml.getLineAttributes().setColor(ColorDefinitionImpl.PINK());
> ml.getLabel().getCaption().setValue("Some marker");
> xAxisPrimary.getMarkerLines().add(ml);
>
>
> Second, the line color stays blue (even though the line markers are green). Interesting, the thickness of the line can be changed, but not the color.
>
> ls.getLineAttributes().setColor(ColorDefinitionImpl.GREEN());
> ls.getLineAttributes().setThickness(3);
>
>
>
> Any hints?
>
>
>
> protected static final Chart buildChart()
> {
> ChartWithAxes cwaBar = ChartWithAxesImpl.create();
>
> // X-Axis
> Axis xAxisPrimary = cwaBar.getPrimaryBaseAxes()[0];
> xAxisPrimary.setType(AxisType.DATE_TIME_LITERAL);
> xAxisPrimary.getOrigin().setType(IntersectionType.VALUE_LITERAL);
>
> // Y-Axis
> Axis yAxisPrimary = cwaBar.getPrimaryOrthogonalAxis(xAxisPrimary);
> yAxisPrimary.getMajorGrid().setTickStyle(TickStyle.LEFT_LITERAL);
> yAxisPrimary.setType(AxisType.LINEAR_LITERAL);
>
> // marker line
> MarkerLine ml = MarkerLineImpl.create(xAxisPrimary, DateTimeDataElementImpl.create(new CDateTime(2010, 2, 1)));
> ml.getLineAttributes().setStyle(LineStyle.SOLID_LITERAL);
> ml.getLineAttributes().setColor(ColorDefinitionImpl.PINK());
> ml.getLabel().getCaption().setValue("Some marker");
> xAxisPrimary.getMarkerLines().add(ml);
>
> // Data Set
> DateTimeDataSet categoryValues = DateTimeDataSetImpl.create(new CDateTime[] { new CDateTime(2010, 1, 1),
> new CDateTime(2010, 2, 1), new CDateTime(2010, 3, 1) });
>
> NumberDataSet orthoValues = NumberDataSetImpl.create(new double[] { 8, 18, -15 });
>
> // X-Series
> Series seCategory = SeriesImpl.create();
> seCategory.setDataSet(categoryValues);
>
> SeriesDefinition sdX = SeriesDefinitionImpl.create();
> xAxisPrimary.getSeriesDefinitions().add(sdX);
> sdX.getSeries().add(seCategory);
>
> // Y-Series
> LineSeries ls = (LineSeries) LineSeriesImpl.create();
> ls.setDataSet(orthoValues);
> ls.setStacked(false);
> ls.getLineAttributes().setColor(ColorDefinitionImpl.GREEN());
> ls.getLineAttributes().setThickness(3);
> ls.getLabel().setVisible(true);
>
> SeriesDefinition sdY = SeriesDefinitionImpl.create();
> yAxisPrimary.getSeriesDefinitions().add(sdY);
> sdY.getSeries().add(ls);
>
> return cwaBar;
> }
>
|
|
|
Goto Forum:
Current Time: Sat Apr 27 04:30:30 GMT 2024
Powered by FUDForum. Page generated in 0.02663 seconds |
") ]
]  Search
 Help
Help Register
 Login
Login Home
Home


