Eclipse SWTChart
Some of you may have already used SWTChart [1], a powerful library for SWT to create bar, line and scatter charts. The project was created by Yoshitaka Yanagidain in 2008. Since then, it has gained a lot of attraction due to its clear and well-designed API.
On June 26, 2018, a proposal was made for SWTChart to become an official Eclipse project. The project creation review was declared successful on October 3, 2018, a milestone that was reached due to the fact that SWTChart was used heavily as part of Eclipse ChemClipse to plot chemical data. The task in ChemClipse is to visualize data from chromatography / spectrometry in a comprehensive way. Many improvements and extensions have been implemented in ChemClipse. In January 2017, Philip Wenig began to refactor the SWTChart extensions of ChemClipse and moved them to a separate bundle to the Eclipse Advanced Visualization Project (EAVP). Over time, the extensions reached a mature status. Therefore, the fact that SWTChart was proposed as an official Eclipse project came at the right time. Both SWTChart and the extensions have been merged and are officially available here:
The benefits of having a marketplace must be staggering since every technology platform now has something similar. But what are they? And who is benefitting? 15 years seems like a good time to think about that once again.
https://projects.eclipse.org/projects/science.swtcharts
https://github.com/eclipse/swtchart
The GitHub repository contains a description of how to easily build the project:
https://github.com/eclipse/swtchart/blob/develop/org.eclipse.swtchart.cbi/Build.txt
Image 1 shows some typical chart extensions of bar, line and scatter plots. On the upper left side, there's a line chart with additional labels. The option to add labels has also been refactored so that it is now easier to see user defined tags. More line charts are shown on the upper right side and bottom center. In settings, one can define if a negative range is shown and/or restrict zooming outside of the available data range. Even a reversed axis can be displayed, which means that the axis direction is not "negative to positive", but "positive to negative". This functionality is especially useful for scientific charts, for example to display FTIR or NMR data. Moreover, a slider can be enabled via settings for each chart. This is a helpful extension when one has to review data series quickly. A bar chart is shown on the lower left side, in this case a mass spectrum with an automatic label option of the displayed five highest m/z values. A scatter plot is shown on the upper center and lower right side, for example to display results from a PCA analysis. To inspect the various settings, have a look at the example charts.
The source code contains a run configuration "SWTChart Extension Examples.launch" which lets you explore many chart demos out of the box.
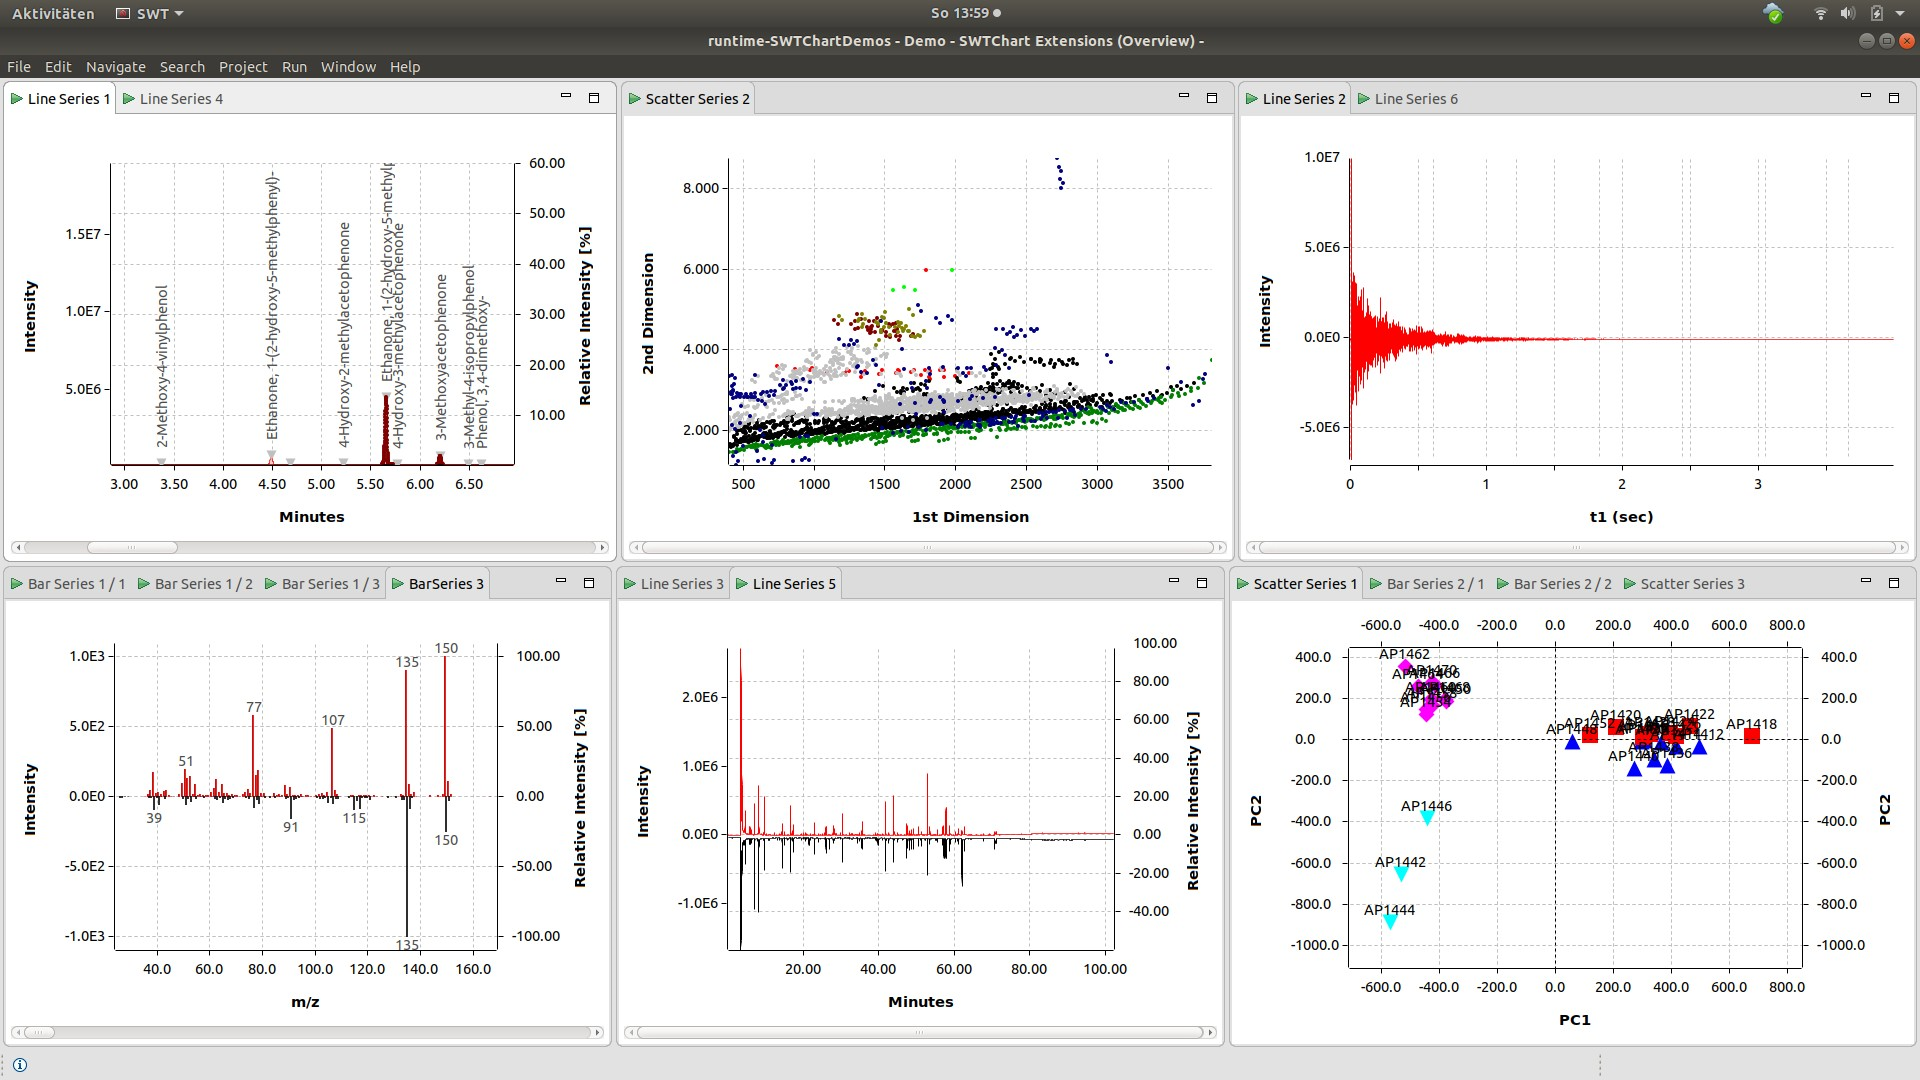
Image 1: SWTChart extension examples of line, bar and scatter plots.
To create a chart, you only need to extend from BarChart, LineChart or ScatterChart. That's it. The primary x and y axis can be modified via the chart settings. Additional secondary x and y axes can also be added/removed dynamically via the chart settings.
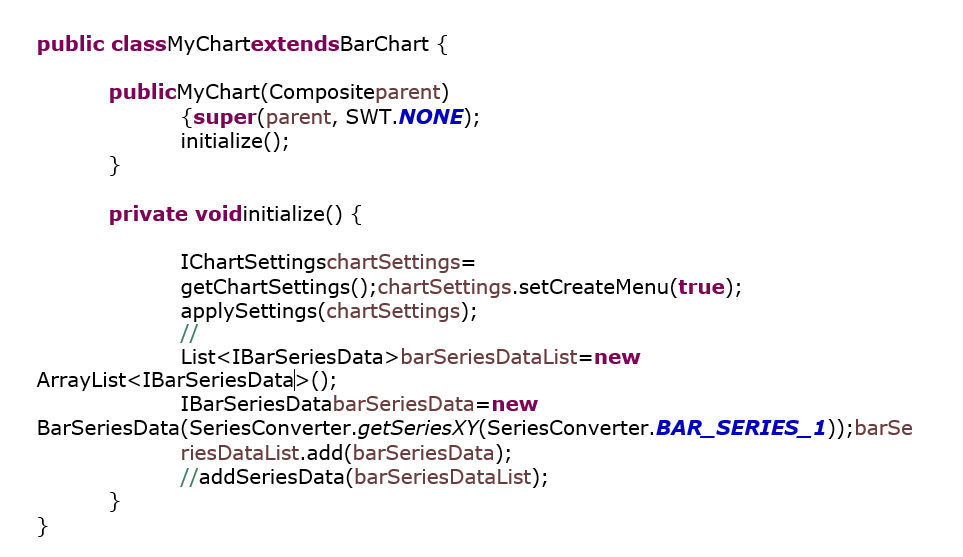
A menu can be enabled/disabled for each chart; it is highly configurable, so that new menu items can be easily added. Furthermore, some or all existing menu items can replaced by user specific actions. By default, the menu allows users to export the data to various output formats, as shown in Image 2. This works seamlessly as each axis can be modified dynamically and the only accepted data format is double [] arrays for x and y series. No specific data container is used which makes it easy to write export extensions. For example, an export to an R script is entirely doable, as you can see in Image 3
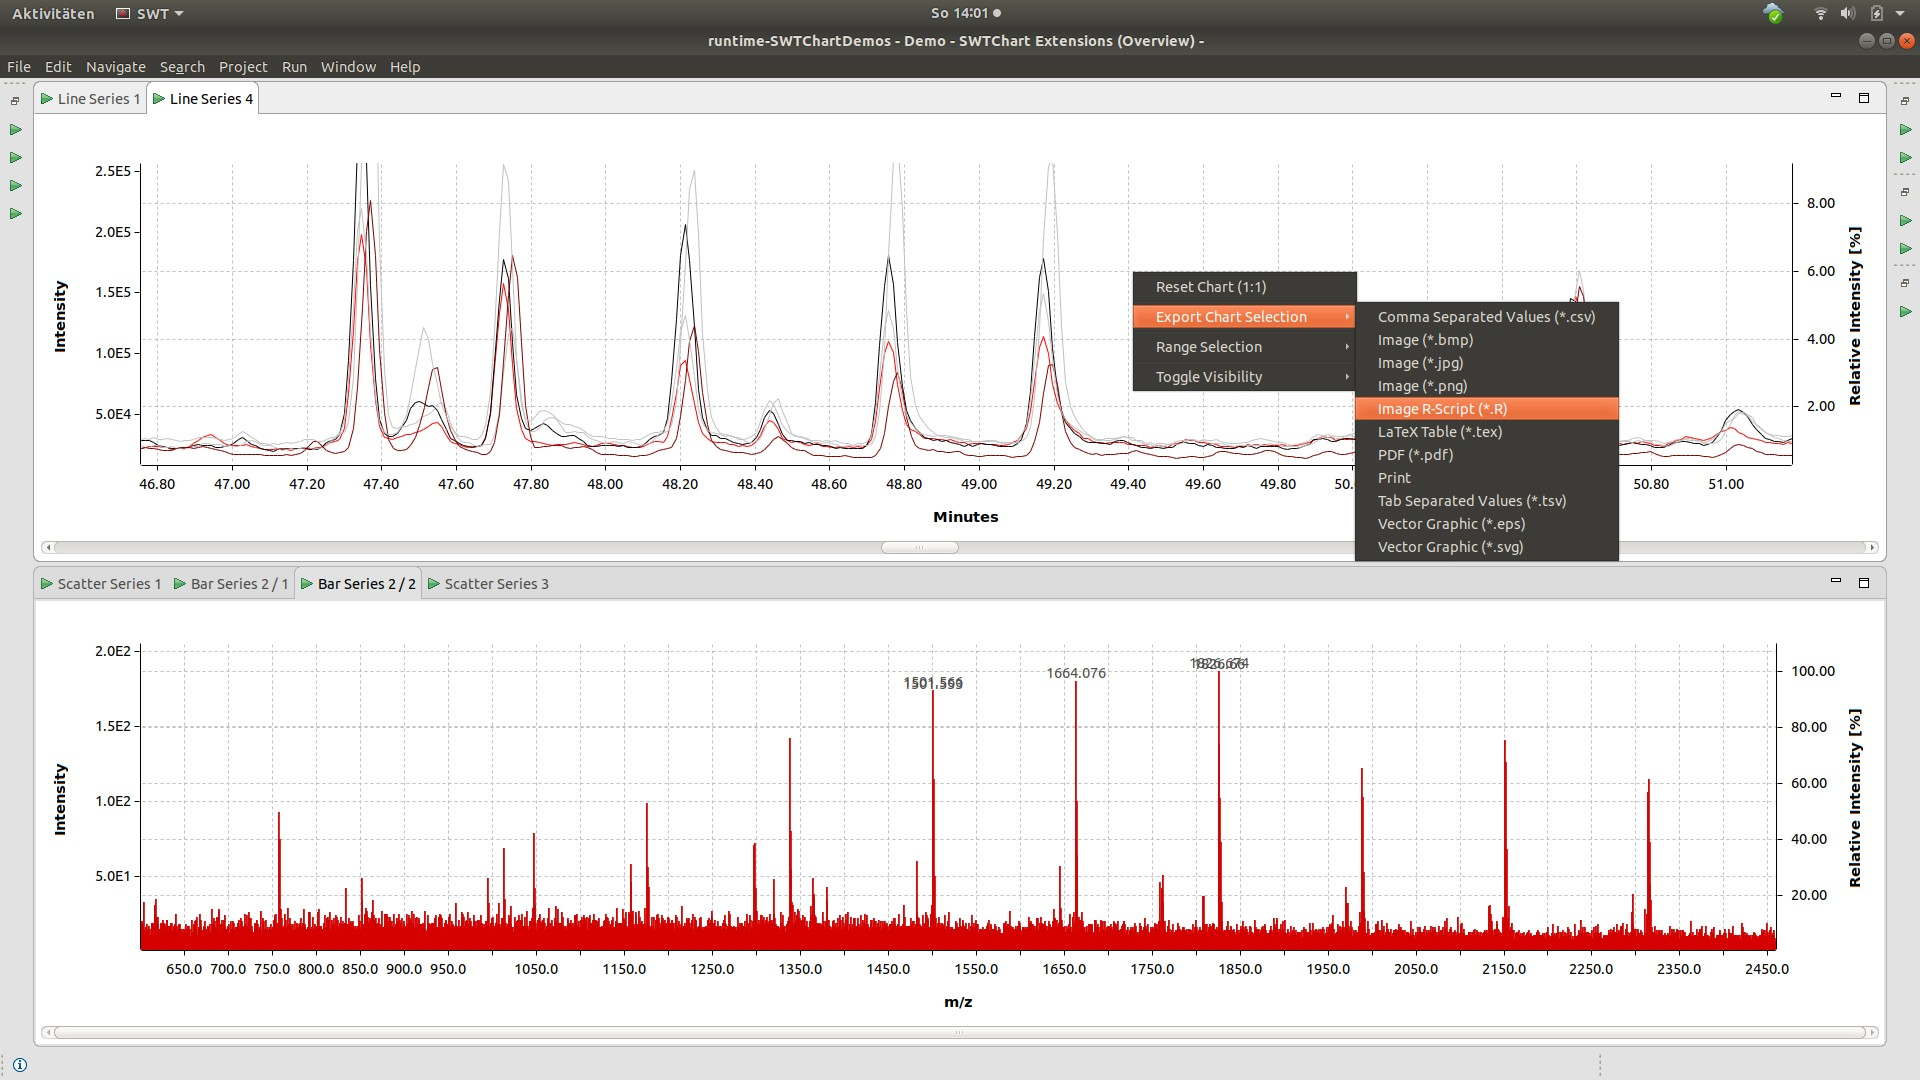
Image 2: Menu export options and display of large data sets.
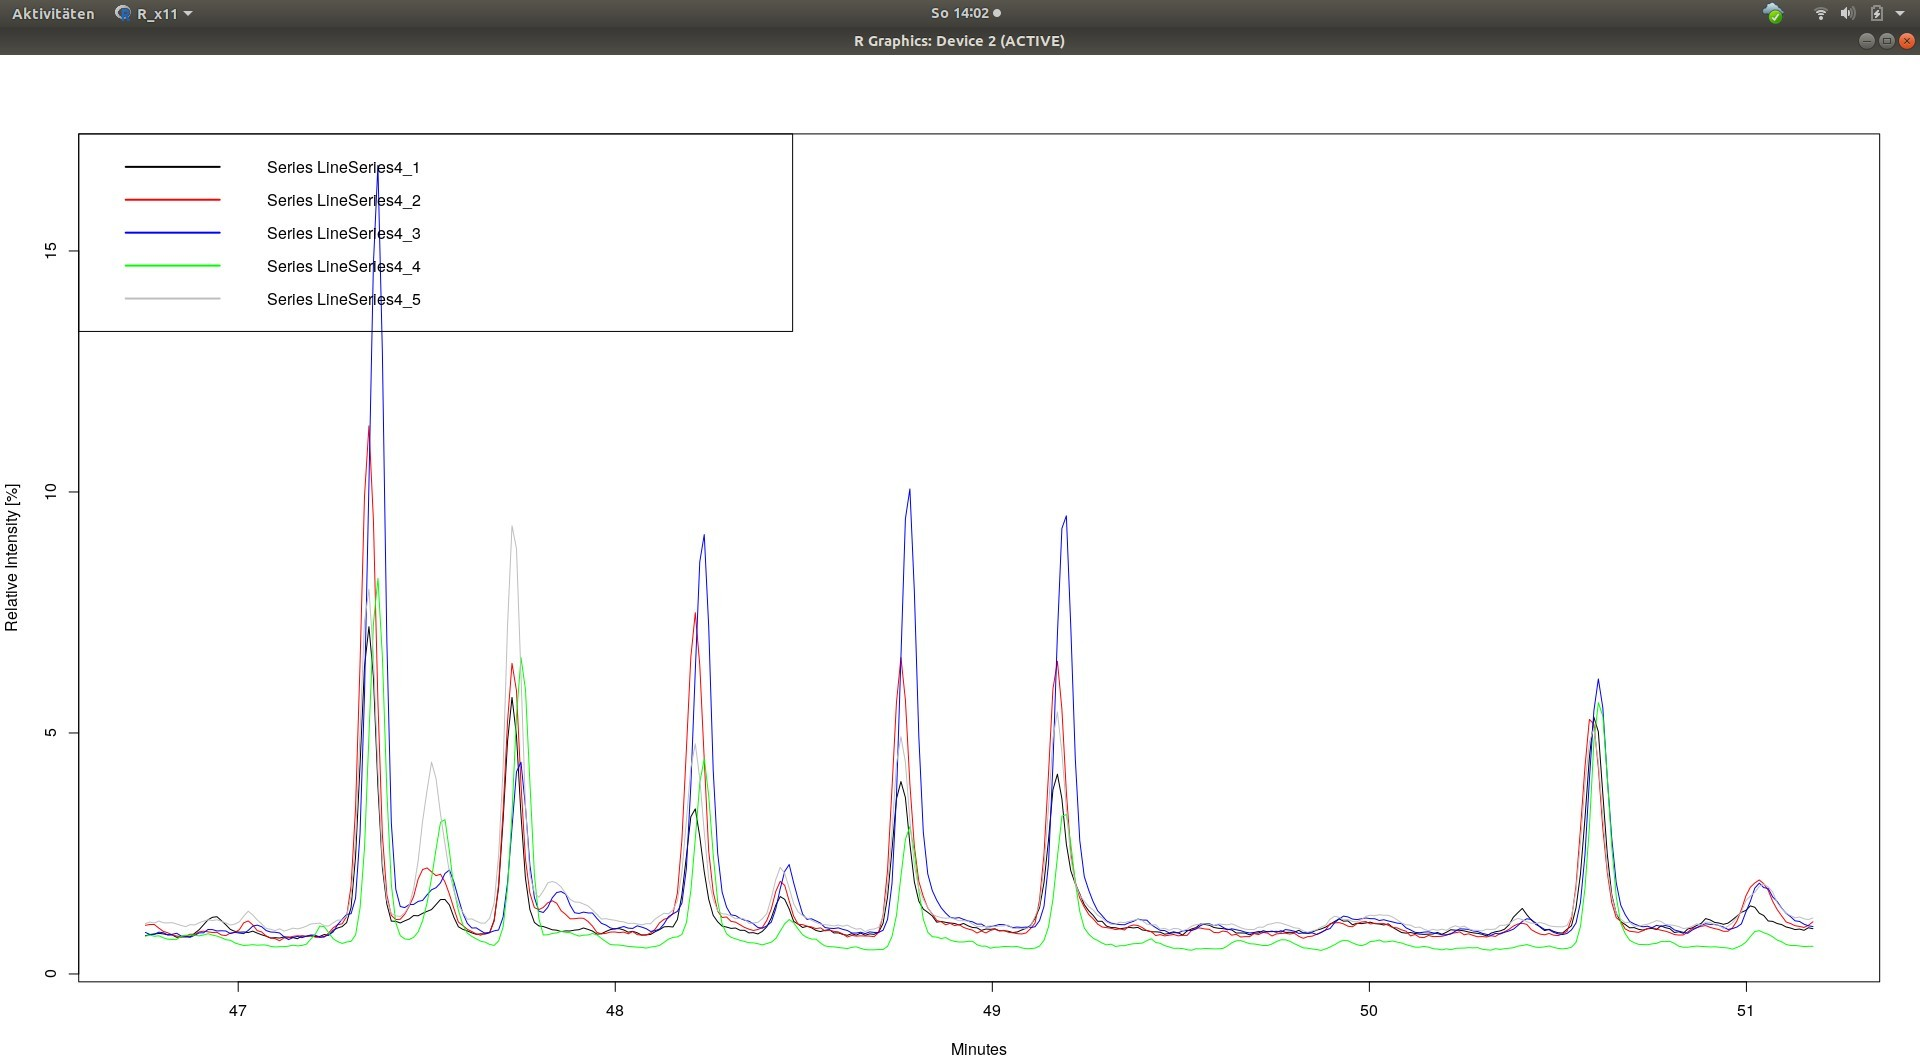
Image 3: Chart data exported to an R script to create a scientific publication.
I hope you like the Eclipse SWTChart project. Contributions and issues can be filed here: https://github.com/eclipse/swtchart/issues
About the Author