Eclipse BIRT Connects IoT
The number of devices being connected to the Internet every day is increasing at a staggering rate. Many of these devices include sensors of all sorts that are constantly capturing and recording data. With this explosion of new devices and data many developers will be called upon at some point to create applications interacting with these devices or analyzing the mounds of data.
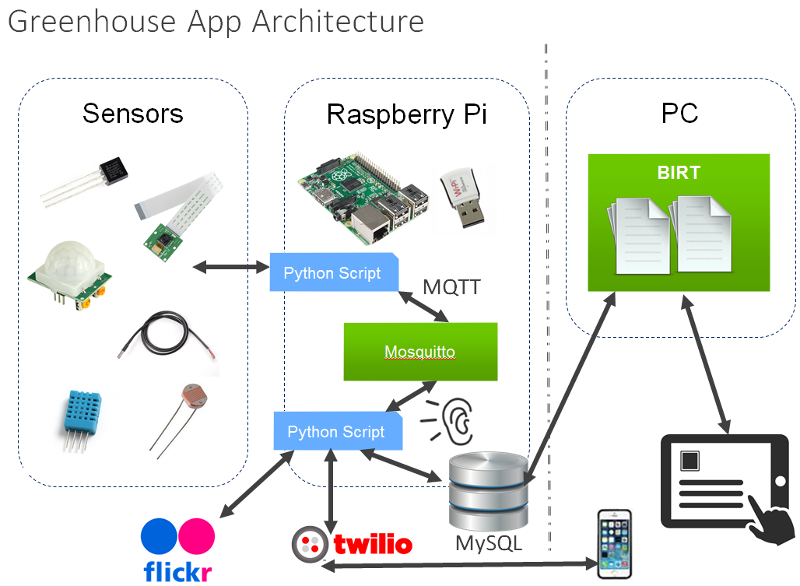
Many devices call themselves ‘smart’ simply because they have an Internet connection or can be controlled remotely, but the real ‘smarts’ come in when once the data from these devices is used with application logic to control themselves or other devices automatically or discover trends in the data they produce that is hard to see by analyzing a single data point. This is where you, as developers, come in and Eclipse BIRT can help. BIRT provides the flexibility and extensibility for you to connect to multiple connected devices, analyze the data, and create and share dynamic visualizations within your applications.
Getting Device Data into BIRT
Creating a visualization starts with creating a BIRT Design in the Report Design perspective in Eclipse. Most of this design process is drag-drop and wizard driven allowing you to quickly create charts, dashboards, reports, etc. from your device data. You can connect multiple data sources allowing you to analyze and create compelling tables and visualizations showing correlations between your connected devices and other data sources.
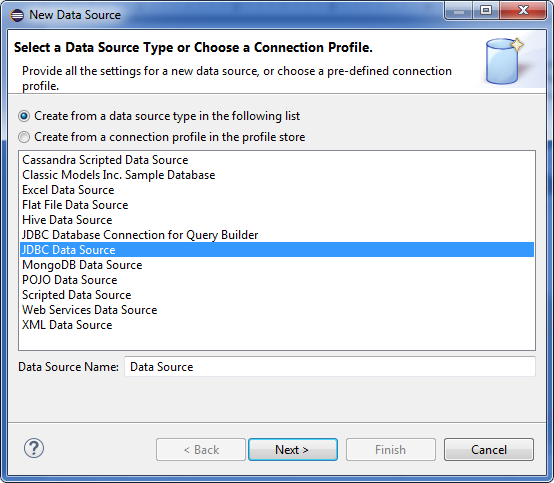
There are several ways in BIRT to get at the device data. Since many of these devices may already be writing to a database, a simple JDBC connection and a few SQL queries is one approach. BIRT also has out-of-the-box support for big data databases, web services, XML, and more, but if you need to read a device directly or start a custom process to get data, then BIRT has you covered as well.
Scripted Data Source
One quick way to add a custom data source in BIRT is by using the Scripted Data Source. This data source allows you to write small bits of JavaScript of Java to go after your data and load a BIRT data set. The Scripted Data Source is saved within a BIRT design file… or can be saved in a BIRT library file for use within multiple designs.
For example, if you have a small Java class named Sensors, you would first initialize that class in the ‘open’ method of a new Scripted Data Set.
sensorDataClass = new Packages.Sensors();
sensorData = sensorDataClass.readData();
totalrows = sensorData.size();
count = 0;
Then, in the ‘fetch’ method, you decide how much data to load by returning ‘true’. In this example, ‘false’ is returned once all the rows of sensor data are loaded from the Class.
if( count >= totalrows ){
	return( false );
}
var currow = sensorData.get(count);

var SensorID = currow[0];
var Name = currow[1];
var Value = currow[2];

row["SensorID"]=SensorID;
row["Name"]=Name;
row["Value"]=Value
count = count + 1;
return ( true );
Extending BIRT’s Data Sources
BIRT, like all Eclipse projects, is based on a collection of plug-ins allowing it to be extended as needed. If you find yourself using a Scripted Data Source on multiple reports, or want your new data source to show up in the list of data sources for others, then you need to create an Eclipse Open Data Access (ODA) plug-in. There are wizards in Eclipse for creating a new ODA project for the first time.
Visualize Historical Data and Trends
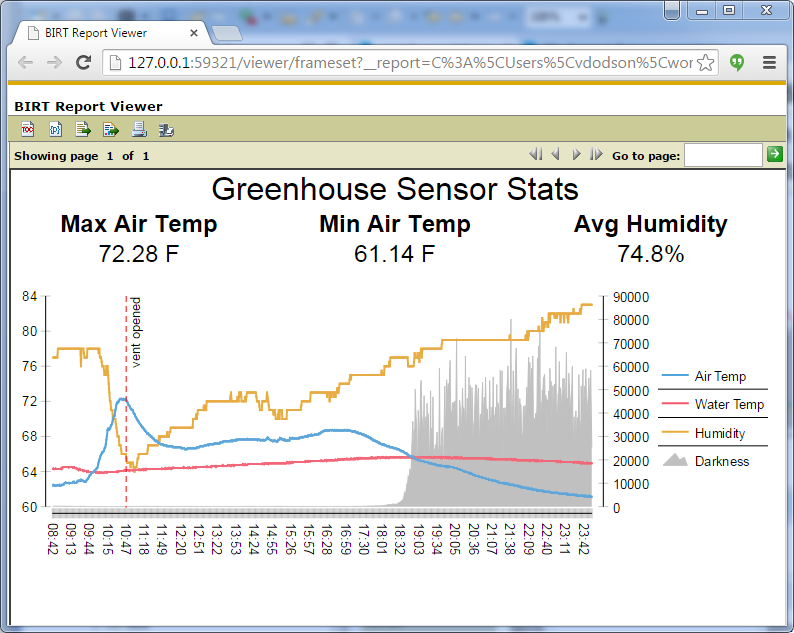
One advantage of persisting your historical device data in a database is the ability to see trends in your data. In the Greenhouse example shown above, a days’ worth of sensor data is displayed. At any given time, knowing the temperature, humidity, and brightness are important but it doesn’t paint the full picture. I might be interested in the humidity only if it stays above 80% for 6 hours or more. In the chart above, I can see trends like a rapid air temperature drop followed immediately by a rapid rise in humidity and determine approximately when the automatic vent opened.
Embedding Data and Chart into Applications
Once a BIRT design is created, you can access that design is a web browser by deploying the sample web viewer available with the BIRT Runtime. You can choose a URL to see the entire report with a toolbar, without a toolbar, or just a portion or a report, like a chart or table.
- http://localhost:8080/birt/run?__report=reportName.rptdesign (without toolbar)
- http://localhost:8080/birt/frameset?__report=reportName.rptdesign (with toolbar)
- http://localhost:8080/birt/run?__report=SD.rptdesign&__bookmark=myTable&__isreportlet=true
For deeper integration, the BIRT Runtime also includes a Report Engine API allowing you to execute and render your BIRT designs directly in Java. Below is a simple example using the RunAndRender Task to convert a BIRT Design directly into a PDF.
static void executeReport() throws EngineException
{
     IReportEngine engine=null;
     EngineConfig config = null;
try{
     config = new EngineConfig( );
     config.setLogConfig("C:\\logs", java.util.logging.Level.FINEST);
     Platform.startup( config );
     IReportEngineFactory factory = (IReportEngineFactory) Platform
  .   createFactoryObject( IReportEngineFactory.EXTENSION_REPORT_ENGINE_FACTORY );
     engine = factory.createReportEngine( config );
     IReportRunnable design = null;
     design = engine.openReportDesign("C:\\designs\\sensors.rptdesign");
     IRunAndRenderTask task = engine.createRunAndRenderTask(design);
     task.setParameterValue("ordParam", (new Integer(10101)));
     task.validateParameters();
     PDFRenderOption options = new PDFRenderOption();
     options.setOutputFileName("my_report.pdf");
     options.setOutputFormat("pdf");
     task.setRenderOption(options);
     task.run();
     task.close();
     engine.destroy();
}catch( Exception ex){
     ex.printStackTrace();
}
finally
{
     Platform.shutdown( );
}
To learn more or to download BIRT, see the Eclipse BIRT project page at https://www.eclipse.org/birt/.
About the Authors