Eclipse OpenJ9; not just any Java Virtual Machine

OpenJ9 is a JVM implementation, but not just any JVM!
Although the Eclipse OpenJ9 project hasn't been around for very long, the VM itself has been around for years. Where? Well, certainly not as an experimental prototype. OpenJ9 has been earning its reputation as an Enterprise grade, production-level component of the IBM® Java development kit, which has been powering IBM middleware products for the last decade or more. IBM contributed the VM to the Eclipse Foundation back in 2017 and more than 70 IBM developers are actively involved in the project. The Eclipse Foundation has a great reputation for Java open source development, so moving OpenJ9 development into this innovative ecosystem puts it in the right place, with the right people.
A large part of OpenJ9 has in fact been living at the Eclipse Foundation for a couple of years now. Eclipse OpenJ9 embeds Eclipse OMR, which provides core runtime components that can be used to build runtime environments for different programming languages. IBM contributed that code too and you can find out more about it on the Eclipse OMR page. At Eclipse OpenJ9, we take OMR and we add extra code that turns it into a runtime environment for Java applications.
So it's been around a long time and it's got a proven track record for reliability, scalability, and performance. Why else would you want to choose it to run your Java applications?
Well, the same version of the VM can be used in an OpenJDK for Java 8, Java 9, and beyond. With a single development head stream, any improvements to the VM can be exploited across multiple versions of Java, providing continuity. And if you aren't ready to leap into the modular world of Java 9 or Java 10 just yet, you can still take advantage of new VM enhancements on Java 8.
We've also got a great story to tell for cloud deployments....
Fast startup and small footprint
Eclipse OpenJ9 has a great story to tell for applications that run in the cloud. With a little configuration, you can almost double the startup speed with about half the memory footprint, compared to other VM implementations. With market trends moving towards the cloud for application development and deployment, this is a compelling reason to choose OpenJ9 as the virtual machine for your runtime environment.
Here are some charts from a recent benchmark test that we ran to compare an OpenJDK 8 with an OpenJ9 VM against an OpenJDK 8 with a Hotspot VM.
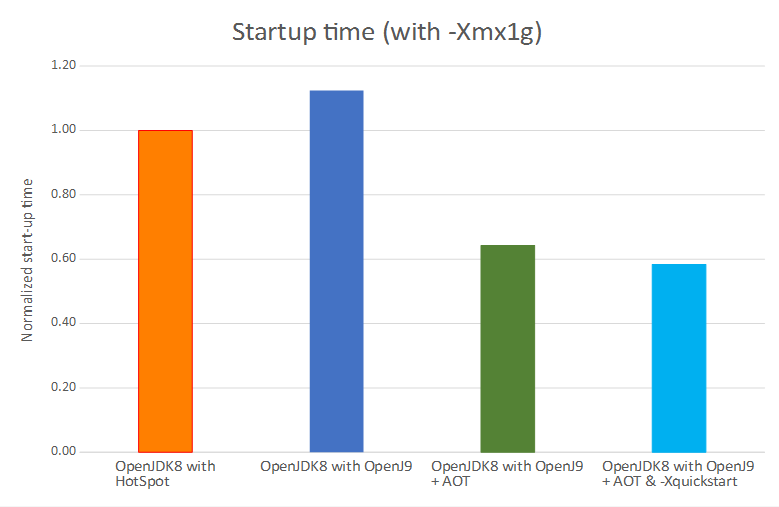
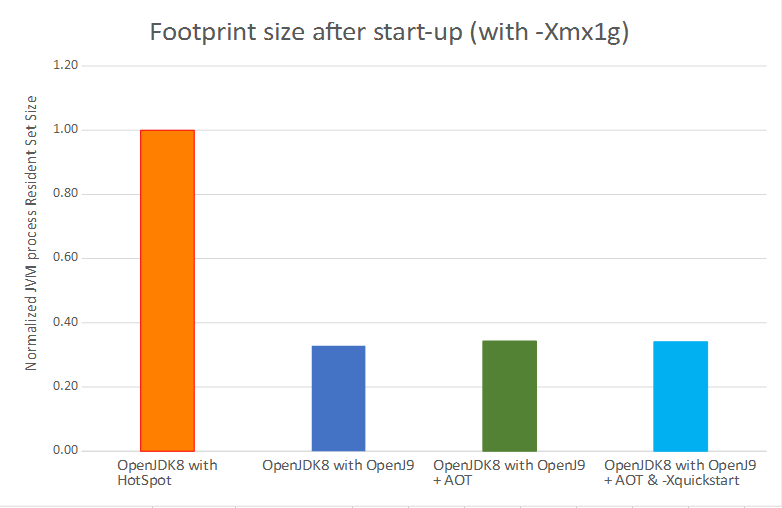
That's a 42% faster startup time and a 66% smaller footprint after startup. Impressive huh?! You can read more about these performance results on the OpenJ9 website. If you want to see what OpenJ9 can do for your Java application, here are some configuration tips for tuning an OpenJDK with OpenJ9:
- Use a shared classes cache (
-Xshareclasses -XX:SharedCacheHardLimit=200m -Xscmx60m) with Ahead-Of-Time (AOT) compilation - Use our idle VM settings (
-XX:+IdleTuningGcOnIdle) - Use our cloud optimization setting (
-Xtune:virtualized)
Class data sharing and AOT
Creating and using shared classes in a cache isn't a new thing, but it is a fundamentally simple way of improving startup performance. The first time an application runs, the VM must load all the classes that are needed to get going. This initialization process takes time. However, if you can store these classes in a cache, the second time the application runs it takes much less time to initialize. It's that simple! In fact, because it makes sense to do so, OpenJ9 always shares both the bootstrap and application classes that are loaded by the default system class loader.
By dynamically compiling methods into AOT code at runtime, the VM can start an application faster because it doesn't need to spend time interpreting Java methods. The VM automatically chooses which methods should be AOT-compiled based on heuristics that identify the start-up phase of large applications. AOT code is always used in combination with shared classes, which means that startup performance gets even better; the cached AOT code can be used to quickly enable native code performance for subsequent runs of your application. When a cached AOT method is run it might also be optimized further by the Just-In-Time (JIT) compiler.
Using a shared classes cache also reduces your memory footprint because multiple VMs can share the same class data. In addition, those parts of the class data that are used for debugging remain on disk instead of in memory, which keeps the footprint as small as possible.
The -Xshareclasses option is highly configurable, allowing you to specify where to create the cache, how
much space to allocate for AOT code and more. You can also set the cache size by using the -Xscmx option. Until
the default size of 16 MB changes (work in progress), we recommend setting a size of at least 60 MB to provide ample space
for shared classes and AOT code. As for AOT itself, it works straight out of the box when you enable shared classes and
doesn't require any special tuning. For small or short running applications, make sure you use the -Xtune:virtualized option,
which helps you get the most out of AOT-compiled code.
For a deep dive into OpenJ9 shared classes technology, read this Class sharing article.
Idle VM settings
Idle tuning is all about keeping your memory footprint small, which can offer cost savings to cloud users and cloud providers. Like it or not, memory footprint tends to grow during the lifecycle of an application because the Java heap fills up with objects that, once used, are no longer referenced. These objects, commonly known as garbage, are removed by a process called garbage collection (GC) when space is needed by an application but nothing is left. However, if an application has a quiet period, the heap might be bloated with tons of garbage but no memory gets reclaimed because GC isn't triggered.
By using the idle tuning feature, cloud users can reduce the cost of running applications on some cloud services, where the usage-charging model is based on memory. For cloud providers, idle tuning offers a unique opportunity to manage their memory resources more efficiently, allowing more virtual machines to run per server.
So how does it work? When you start your application, specify -XX:+IdleTuningGcOnIdle on the
command line. When set, OpenJ9 determines whether an application is idle based on CPU utilization and other internal
heuristics. When an idle state is recognized, a GC cycle runs if there is significant garbage in the heap and releases unused
memory back to the operating system. This option can be used along with other options that determine how long the VM
should wait before triggering the process, and what percentage of free memory pages in the heap should be released.
You can also tell the GC to compact the heap before releasing free memory, which might make further memory savings.
Idle tuning is covered in more detail in this Developer Center article.
Cloud optimization setting
The -Xtune:virtualized option is designed to configure OpenJ9 for typical cloud deployments where VM
guests are provisioned with a small number of virtual CPUs to maximize the number of applications that can be run.
When this option is enabled, OpenJ9 adapts its internal processes to reduce the amount of CPU consumed and trim down the memory footprint. These changes come at the expense of only a small loss in throughput, so are well worth the tradeoff.
If we've got you itching to try it out already, you could hop straight over to the AdoptOpenJDK project where you can pick up prebuilt, JCK-certified, OpenJDK binaries that run with the OpenJ9 VM. But before you do, read on to find out more about the OpenJ9 JIT compiler, our choice of garbage collection policies, and how you can get involved in the project.
The JIT compiler
The Just-In-Time compiler is a key component of the OpenJ9 VM, and improves the performance of Java applications by compiling platform-neutral Java bytecode into native machine code at run time. Without the JIT, the VM has to interpret the bytecodes itself - a process that requires extra CPU and memory, which effectively applies the brakes!
The JIT compiler doesn't compile every method that gets called. After all, thousands of methods can be called at startup and if the JIT tried to compile all of them, the application would take way too long to start. Instead, OpenJ9 records the number of times a method is called. When the count reaches a pre-defined invocation threshold, JIT compilation is triggered. Once a method has been compiled by the JIT, the VM can call the compiled method rather than interpreting it.
The JIT compiler can compile a method at different optimization levels: cold, warm, hot, very hot (with profiling), or scorching. The hotter the optimization level, the better the expected performance, but the higher the cost in terms of CPU and memory.
- cold is used during startup processing for large applications where the goal is to achieve the best compiled code speed for as many methods as possible.
- warm is the workhorse; after start-up, most methods are compiled when they reach the invocation threshold.
For higher optimization levels, the VM uses a sampling thread to identify methods that continue to take a lot of time. Methods that consume more than 1% are compiled at hot. Methods that consume more than 12.5% are scheduled for a scorching compilation. However, before that happens the methods are compiled at very hot with profiling to collect detailed profile data that is used by the scorching compilation.
The higher optimization levels use special techniques such as escape analysis and partial redundancy elimination, or loop through certain optimization sequences more times. Although these techniques use more CPU and memory, the improved performance that is delivered by the optimizations can make the tradeoff worthwhile.
Garbage collection
To prevent applications running out of memory, objects in the Java heap that are no longer required must be reclaimed. This process is known as garbage collection (GC). When garbage is collected, the garbage collector must obtain exclusive access to the heap, which causes an application to pause while all the tidying up is done. This pause is often referred to as a stop-the-world pause because an application can do absolutely nothing until the process completes. In general, the first step in the process is to mark the objects that are reachable, which means they are still in use. The next step is to sweep away the unmarked objects to reclaim memory. To an end user, an obvious pause in application processing might look like an application has hung, so you might want to choose when and how this housework is done.
Eclipse OpenJ9 has a number of GC policies designed around different types of applications and workloads. Picking the right policy very much depends on your usage and performance goals.
If you have a transactional application, with many short lived objects, the Generational Concurrent (-Xgcpolicy:gencon)
GC policy is probably best suited, which aims to minimize GC pause times without compromising throughput. This is the
default policy employed by the VM, so if you want to use it you don't need to specify it on the command line when you start your
application.
We also have the following alternative GC policies:
-Xgcpolicy:balanceddivides the Java heap into regions, which are individually managed to reduce the maximum pause time on large heaps and increase the efficiency of garbage collection. The aim of the policy is to avoid global collections by matching object allocation and survival rates. If you have problems with application pause times that are caused by global garbage collections, particularly compactions, this policy might improve application performance, particularly on large systems that have Non-Uniform Memory Architecture (NUMA) characteristics (x86 and POWER™ platforms).-Xgcpolicy:metronomeis designed for applications that require precise response times. Garbage collection occurs in small interruptible steps to avoid stop-the-world pauses.-Xgcpolicy:optavgpauseuses concurrent mark and sweep phases, which means that pause times are reduced when compared tooptthruput, but at the expense of some performance throughput.-Xgcpolicy:optthruputis optimized for throughput by disabling the concurrent mark phase, which means that applications will stop for long pauses while garbage collection takes place. You might consider using this policy when high application throughput, rather than short garbage collection pauses, is the main performance goal.
A little more about the Metronome GC policy, which is receiving quite a bit of interest lately.
If your application depends on precise response times and you are running on x86 Linux™ or AIX®, you might be interested
in using the Metronome (-Xgcpolicy:metronome) policy.
The key difference between Metronome and other policies is that garbage collection occurs in small
interruptible steps rather than stopping an application completely while garbage is marked and collected. By default,
Metronome pauses for 3 milliseconds (ms) at a time. A full garbage collection cycle requires many pauses,
which are spread out to give the application enough time to run. You can limit the amount of CPU that the GC process uses
and you can control the pause time. In the following example, yourApp runs for 80% in every 60 ms with the
remaining 20% of the time allocated for garbage collection, if there is garbage to be collected. Additionally, individual
pauses for Metronome are set to be no longer than 10 ms:
java -Xgcpolicy=metronome -Xgc:targetUtilization=80 -Xgc:targetPauseTime=10 yourApp
The Metronome GC policy guarantees utilization levels if it has been given sufficient resources. Garbage collection begins only when the amount of free space in the heap falls below a dynamically determined threshold. Choosing the optimum settings for your application is best achieved with a monitoring tool like Garbage Collection Memory Visualizer (GCMV), where you can monitor the GC pause times for your application and adjust the settings to maximize performance.
There's another special GC mode of the gencon policy that deserves a separate mention:
Concurrent Scavenge (-Xgc:concurrentScavenge). This mode works with the Guarded Storage (GS)
Facility, which is a feature of the IBM z14™ mainframe system. The aim is to minimize the time spent in
stop-the-world pauses by collecting garbage in parallel with running application threads. The GS Facility
provides hardware-based support to detect when potentially stale references to objects are accessed by an application.
This means that the garbage collector can start processing objects in parts of the heap without halting an application
because the GS Facility is on hand to spot accesses to an object and send a notification. The object that was ready to
be swept away can be moved, and references to it can be reset. The complex interactions that are involved between the
VM and the GS Facility are beyond the scope of this article, but you can read more about it in the following blog posts:
- Reducing Garbage Collection pause times with Concurrent Scavenge and the Guarded Storage Facility
- How Concurrent Scavenge using the Guarded Storage Facility Works
Note: Concurrent scavenge mode is available only on the z/OS® platform.
We hope this article has given you some insight into the pedigree and strengths of the Eclipse OpenJ9 VM. Remember: Fast startup, small footprint, great throughput performance, optimized for cloud, reliable, scalable, and secure. Why not try it out and tell us what you think? Go on.. give your Java application a thrill. Run it on OpenJDK with Eclipse OpenJ9!
If you want to find out more about the project, our Eclipse OpenJ9 website is a good place to start. You'll find some key information about OpenJ9, including our impressive performance measurements, and links to all sorts of useful resources.
Recent Webinar
vECM: Eclipse OpenJ9- Eclipse's own JVM
If you missed the recent Virtual Eclipse Community Meetup (vECM) given by Dan Heidinga on Eclipse OpenJ9, you can catch up on YouTube.
Want to get involved?
Why not join us on slack where you can chat to our developers? Request an invitation
Come along to one of our weekly "Ask the OpenJ9 community!" calls. For eMeeting links and agendas, check the #planning channel in our slack workspace. To add these meetings to your Google calendar, add the OpenJ9 hangouts calendar.
Useful links
About the Authors