Effective Techniques for Debugging C & C++
Eclipse CDT features a rich debug environment that helps developers track down bugs and performance issues in their C/C++ code. Whether using gdb or a different backend debugger, CDT Debug provides a consistent visual interface and has several powerful views that provide different insights into your code. This article highlights some of the newest and most useful features in Eclipse CDT 9.2 edition that helps save precious time while debugging your code.
Step Into Selection
Typical run control allows you to navigate through your code with commands such as run, stop, step, etc. ‘Run to line’ is particularly handy when you want to get to a specific portion of code. Additionally, another great time saver is the ‘Step Into Selection’ command. This is useful while debugging a particular bit of code and you want to step into one call without having to tediously step in and out of calls made on the same line. This is particularly the case with C++ where you might have a lot of getter calls as arguments to another method. There are a number of ways to invoke this command, depending on your particular preference.
While debugging, select the method of interest and:
- Press
CTRL+ALTand click on the method (by far the quickest way to use it). - Right-click and select ‘Step Into Selection’ from context-menu.
- Use keyboard shortcut
CTRL+F5
The example below shows while debugging the Python source code, how you can set straight into the _PyMem_RawStrdup method while avoiding the setlocale if you just did a normal step into.
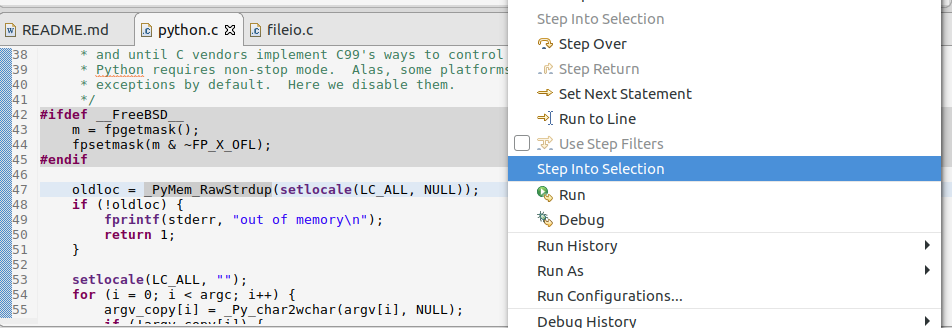
Step into selection means no need to step through any more tiresome setters and getters!
Dynamic Printf
Dynamic printf gives you the ability to insert a printf call into your program on-the-fly, without having to recompile it or restart it. Your source code remains unchanged once you’ve finished debugging. Dynamic printf is a type of software trace which helps avoids serious slowdowns of code instead of having to stop at a regular breakpoint. Dprintf can be used with printf style formatting and expressions to make more useful debug messages.
The following screenshots show dynamic printf being used to trace the calls to the write method in the C-Python source.
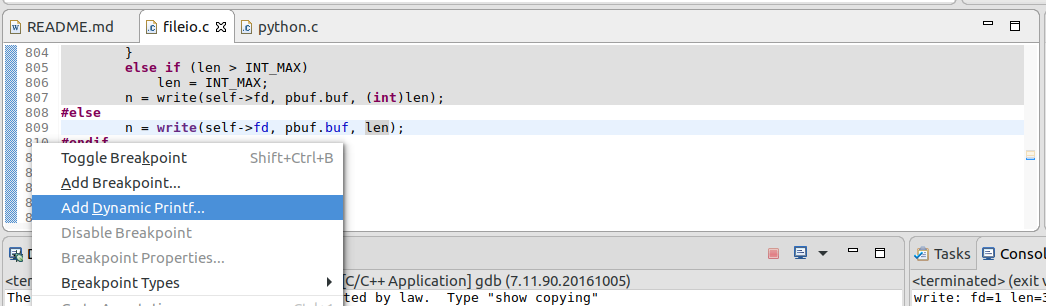
- Right click on margin to insert a dynamic printf.
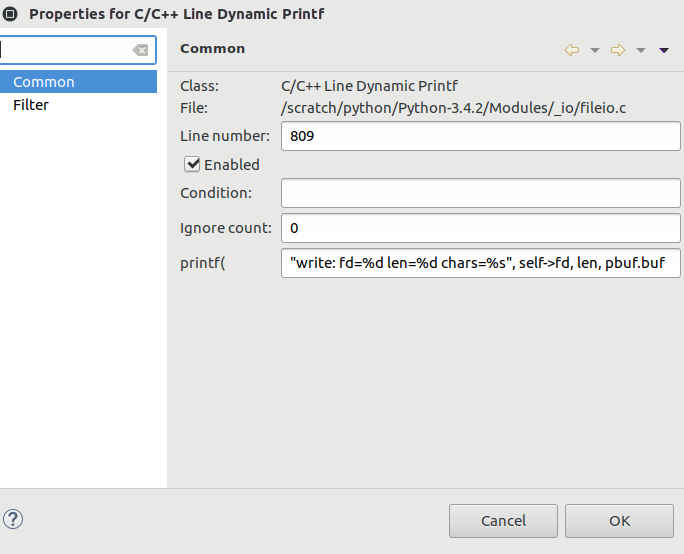
- Customise dprintf properties, using printf style formatting.
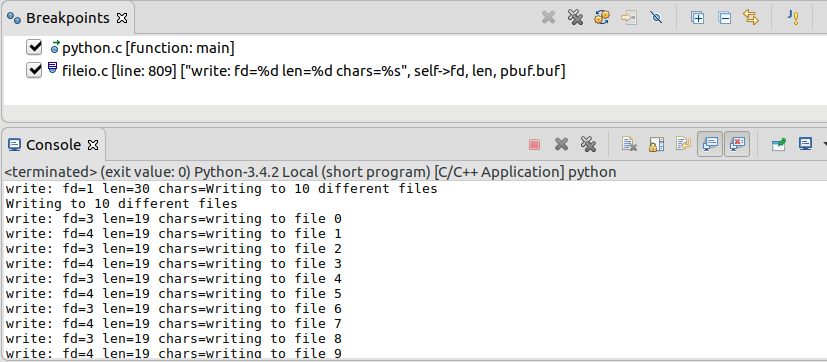
- Dprintf can be seen in breakpoints view, messages are written to console every time the dprintf is hit.
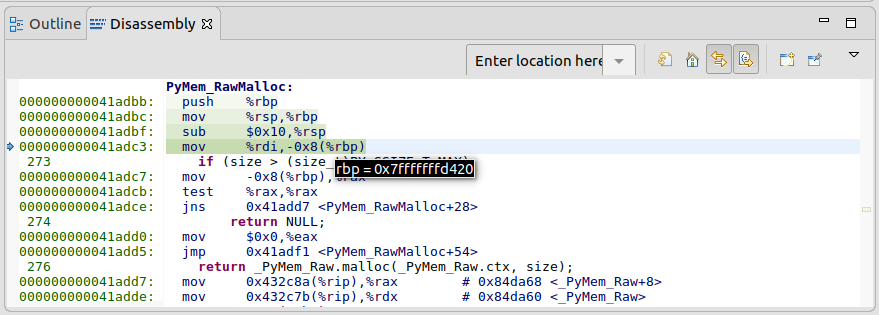
Disassembly View
This is a great feature for embedded developers, debugging drivers or for anyone operating at the assembly language level. You can quickly switch to disassembly view, which gives you a nice shading as you step through the code. A new feature in Eclipse Neon is that you can hover over registers to see their value instantly, another great time saver over having to open the registers view and find the register of interest.
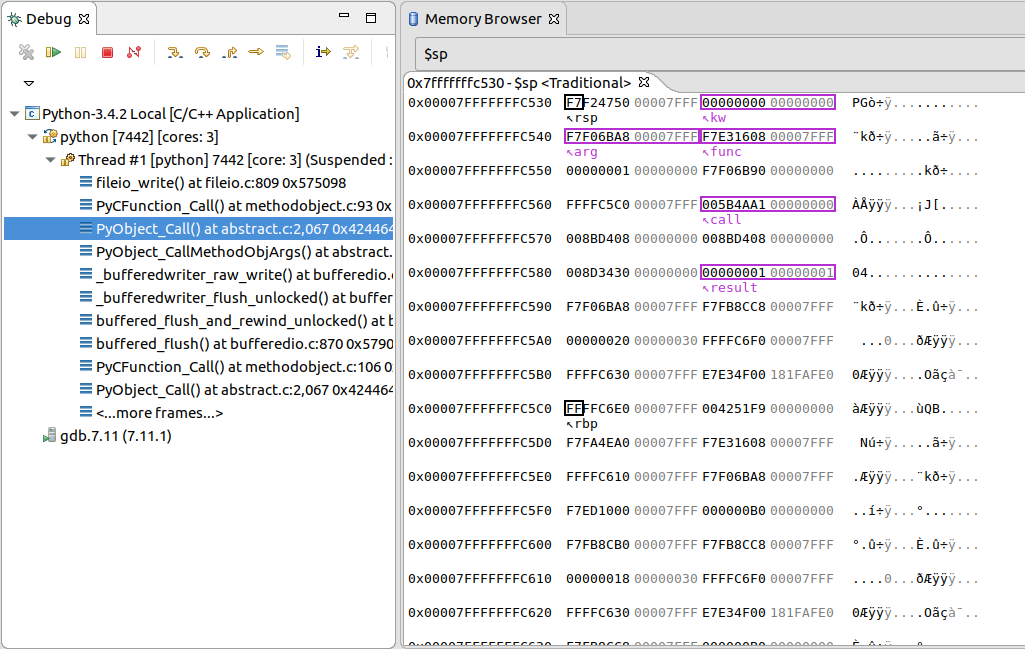
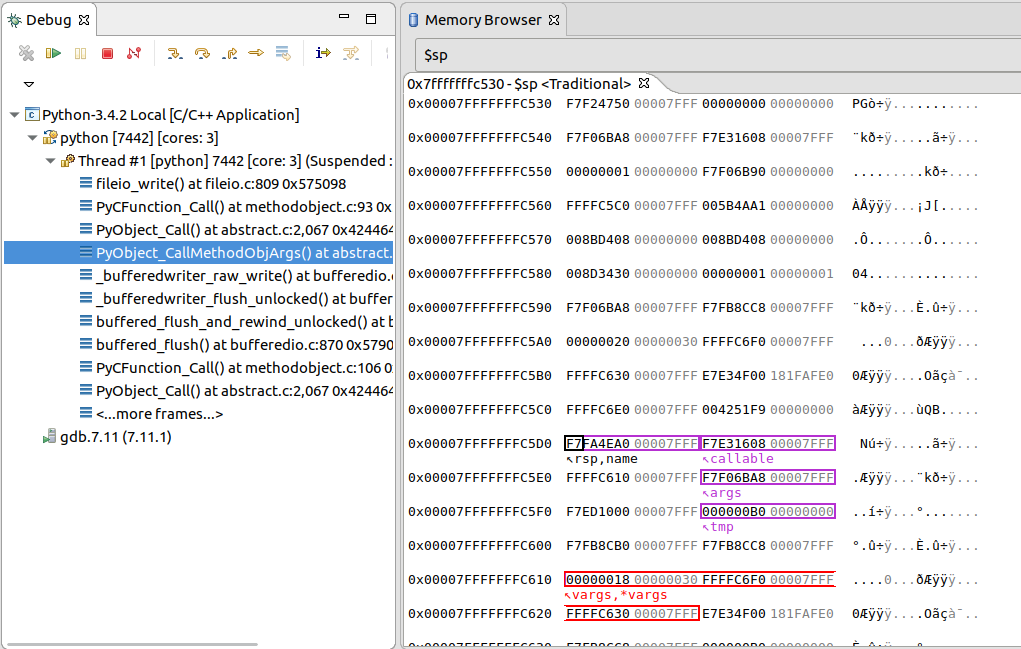
Memory View
When you need insight into your program’s memory, CDT has a handy memory view to use. The memory view displays the bytes and can be easily rendered in different formats to support the data being inspected. New in CDT 9, the memory view comes with annotations to help the user quickly map pointers, variables, etc to the bytes in the memory view.
Here’s an example looking at the stack pointer while debugging the fileio_write call in CPython. The memory view updates as you click on various levels of the stack trace in the debug view.
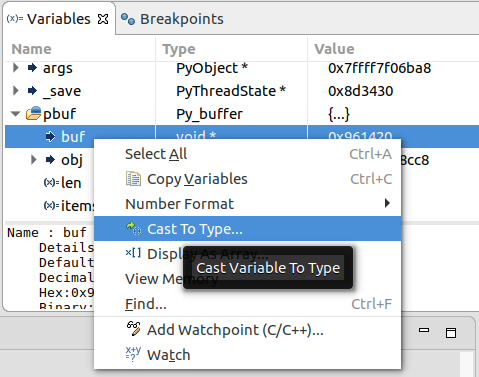
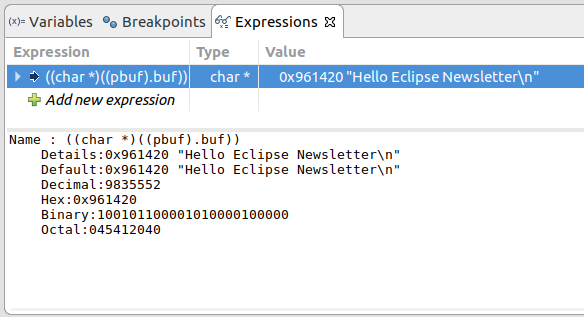
Optimal Watch Expressions
While debugging, although variables can be inspected, in some cases the value of the variables is not always interpreted in the optimal format. In this case, you can right click on the variable and use the ‘Cast To Type’ method to change it to a more appropriate type, for example from a void * to a char * for a String. And if you want to keep that for later, you can right click and select ‘Watch’ which will create a full expression which can be very useful.
These are just some of the features available while debugging CDT. To see some of these latest debug features in actions, take a look at this talk from Jonah Graham in which he debugs the CPython codebase using CDT, demonstrating the features here and more.
Eclipse CDT provides a rich debug interface with lots of features to help every C/C++ developer get to the heart of their issue in the most effective way.
About the Author