Debugging Highly Complex Applications
Multicore hardware is already a reality for industries such as telecommunication, automotive, consumer electronics, and aerospace. Chips with hundreds, and even thousands of cores are the focus of many chip makers (www.tilera.com, www.adapteva.com, www.kalray.eu, www.plurality.com, etc) and are quickly becoming the most realistic step towards more computing performance. With such technology however, software is becoming dramatically more complex, and problems exceedingly difficult to debug.
Multicore Visualizer
Visualization techniques help developers cope with the complexity ensuing from multicore technologies by presenting large numbers of items in a graphical summary.
With this in mind, the CDT provides a Multicore Visualizer view which displays a graphical representation of the state of the application. It allows a user to click- and drag-select groups of threads, and apply debugging commands to them directly from the Visualizer view, commands such as Resume, Suspend, Step. The Multicore Visualizer is designed to scale to large numbers of CPUs and cores-per-CPU on both current and future multicore hardware.
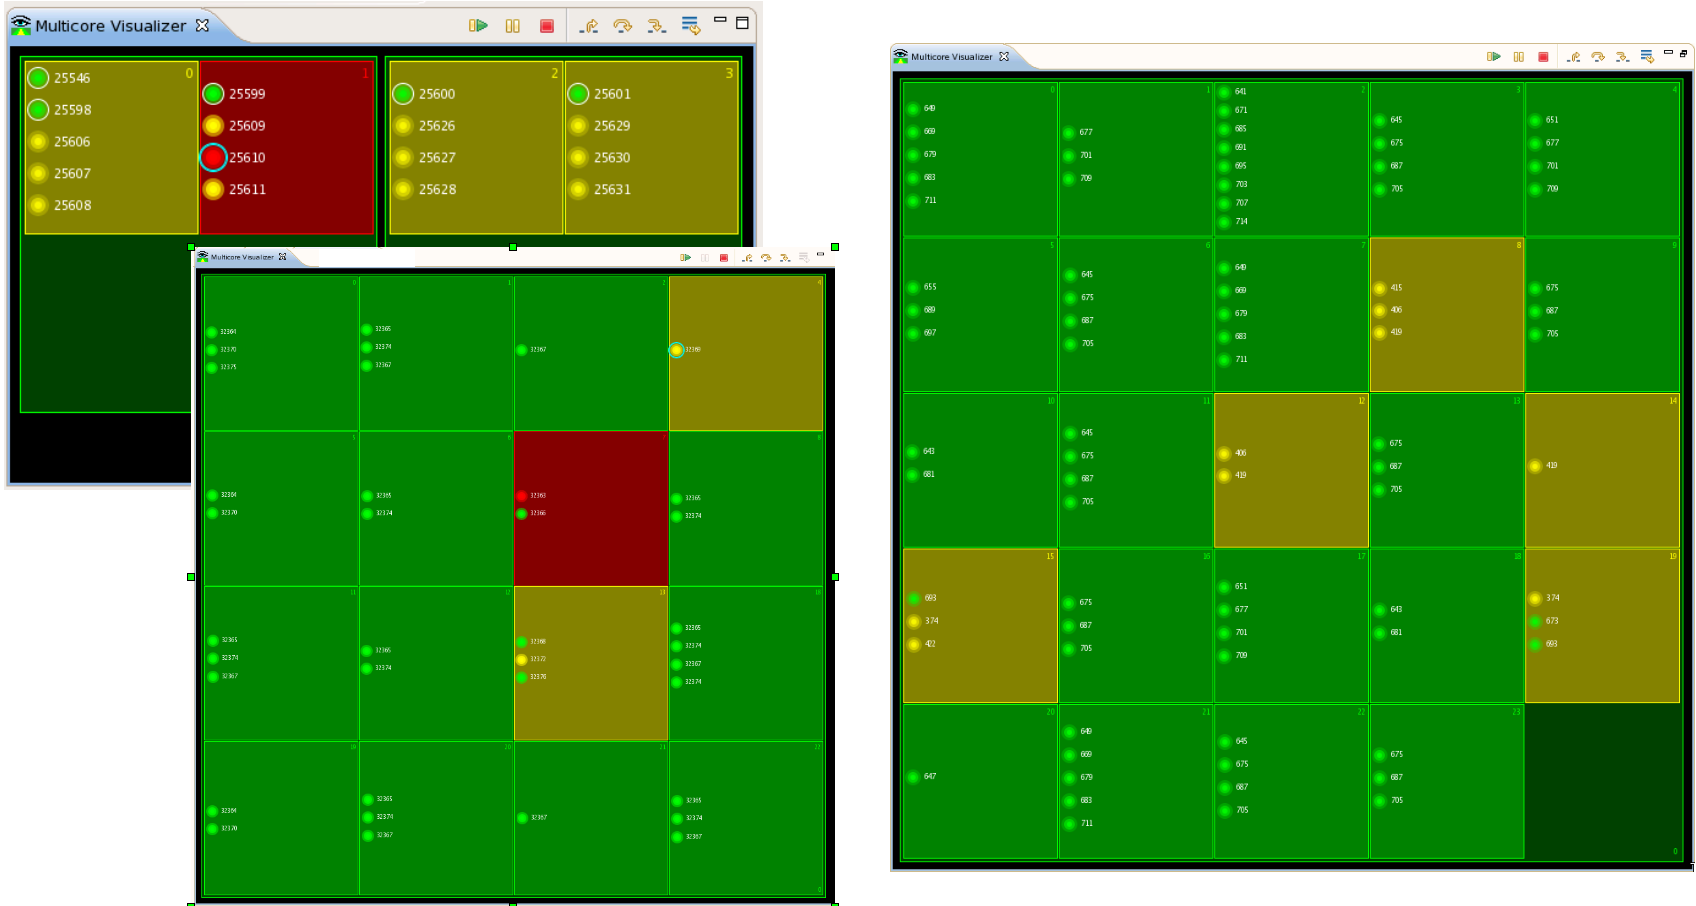
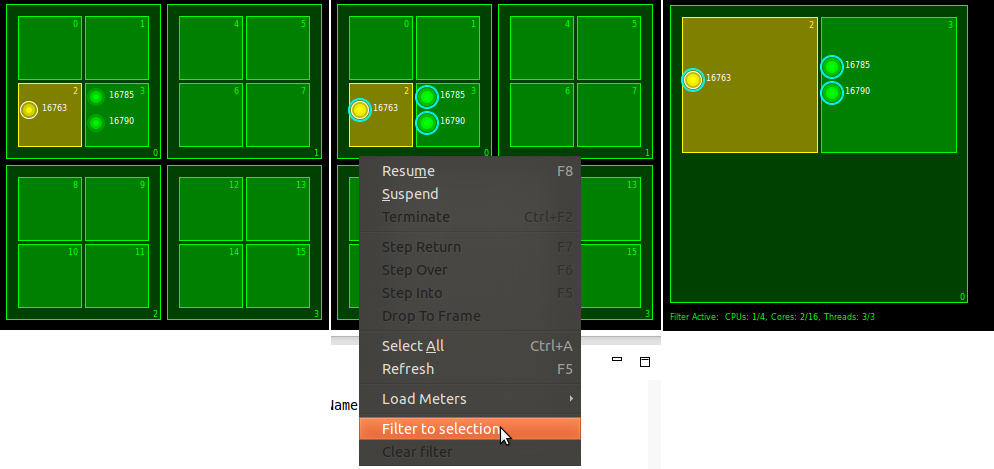
In the above screenshots, threads are represented by colored circles contained in squares that represent cores. The green and yellow colors are used to denote the running and interrupted states of execution, respectively, while the color red indicates a crash of the application. Execution states, and therefore colors, are prioritized in such a way that a crash takes precedence over an interrupted state, which in turn takes precedence over a running state. This explains why a core is shown red or yellow although some of its threads are in the running state.
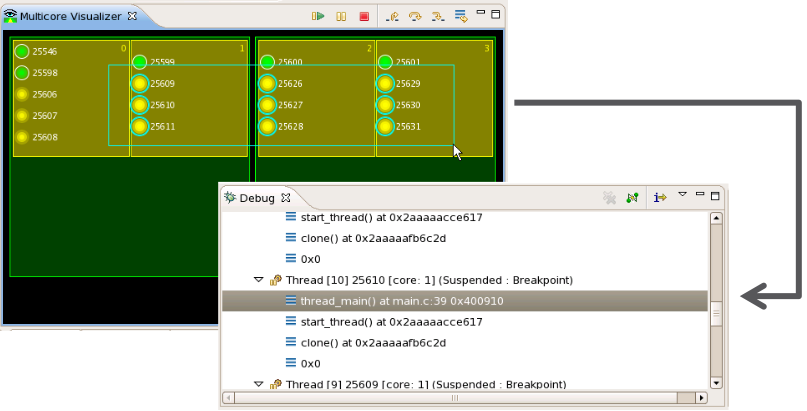
The Multicore Visualizer is meant to serve as a high-level visual overview of the current application, and can be used in tandem with the Debug View, which provides more in-depth details. Selections made in the Visualizer view are reflected automatically in the Debug view, and vice versa.
Load Monitoring
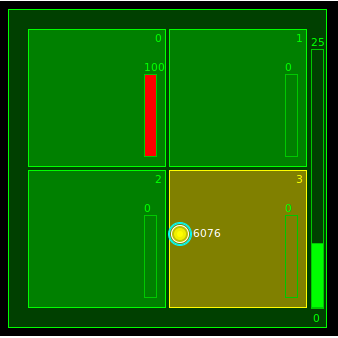
With multicore hardware, proper usage of computing resources can become a challenging problem. Software bugs causing inefficient balancing of load, or even starvation of cores, can negate the benefits of the hardware. The Multicore Visualizer therefore supports system-load monitoring, in the form of graphical load-meters. When enabled and space permitting, a load-meter is displayed for each core and also one for each CPU. The load-meters of the cores display the load of each core of the system being debugged, while the CPU load-meters show the average load for all cores contained in that CPU.
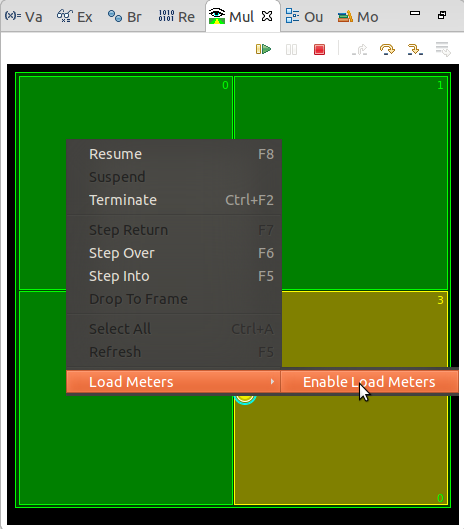
To enable load monitoring, one can use the context-menu of the Visualizer view:
Using the load-monitoring feature can quickly bring resource utilization bugs to the attention of the developer. Enhancements to this feature are already being discussed to be able to handle chips with thousands of cores, where a graphical load-meter for each core simply won’t fit in the very busy display.
Filtering
With potentially thousands of cores being displayed by the Multicore Visualizer, users will need to gradually focus on subsets of cores and/or threads that are determined to be problematic. For example, using the Multicore Visualizer, a developer could notice that a particular subset of cores show regular software crashes; in that case, the developer will want to focus on that subset, and perform specific debugging operations on those cores, or visualize more detailed information about the execution of these cores.
With that in mind, the Multicore Visualizer provides a filtering feature. To filter the view, first select the graphical elements you want to keep, then, from the context menu, choose "Filter to selection". The selected graphical elements will be shown, along with any parent objects; for instance a thread will be shown in its core and CPU. The filter stays in place until cleared, using the context menu "Clear filter".
Hardware Layout and Communication
As the number of cores on multicore chips increases, their location with respect to each other will have a great impact on performance. For example, it is very often the case that two cores adjacent to each other can communicate much faster than cores that are separated by one or more other cores; in fact, in many models, the larger the number of cores separating two cores, the longer the delay in communication.
Software aimed at such chips will need to take this reality into consideration. Consequently, proper debugging tools will need to help developers pin-point these communication inefficiencies.
Currently the Multicore Visualizer provides a generic display of multicore chips that does not take a chip’s actual layout into consideration. However, we are currently working on providing a display that will show chip-specific layouts. Such a display could then be enhanced to monitor communication paths and provide insights into inefficiencies. Furthermore, such hardware-specific displays could also include other components such as memory and caches.
Installation
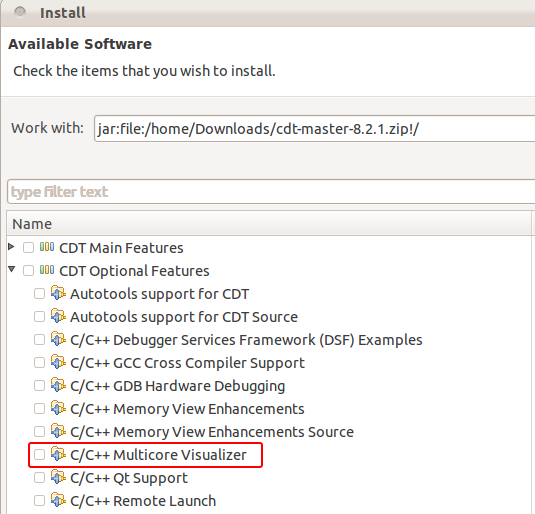
The Multicore Visualizer is an optional feature of the CDT and must be installed manually from the CDT p2 repository (http://download.eclipse.org/tools/cdt/releases/kepler) or downloaded as part of a CDT archived p2 repository.
Step-Into-Selection
One of the pain points when debugging non-trivial applications is the difficulty of stepping into a method (or function) when multiple methods are on the same line. Imagine that the execution of the program is currently interrupted at the following line:
result = subtract( multiply( add( a, b ), 3 ), 5 ); // line 20
If the user wishes to step into the subtract() method, multiple StepInto operations are necessary. Let’s look at the details of the required effort.
First a StepInto is performed to bring the debugger inside the add() method (the first method to execute on line 20).
int add(int arg1, int arg2) {
        return arg1 + arg2;
}
As this is not the method of interest, the user then performs a StepReturn to get back to line 20. A second StepInto is then done to bring us within the multiply() method (the next method to execute on line 20).
int multiply(int arg1, int arg2) {
        return arg1 * arg2;
}
Again this is not the method of interest, so another StepReturn is done. Finally it is only at the third StepInto that we end up in the subtract() method.
int subtract(int arg1, int arg2) {
        return arg1 - arg2;
}
This adds up to 5 stepping operations, although the user knew from the start where the final StepInto should have been done.
The traditional way to address this situation is to have the user set a breakpoint at the start of the subtract() method and resume execution. Beyond the obvious tediousness of having to find the implementation of the method, set the breakpoint, and then remove that breakpoint once the operation is completed, this approach does not lend itself well to method overriding. For example, if multiple subclasses have overridden the subtract() method, the user would have to determine which one will be called before properly setting the breakpoint, or would need to set a breakpoint at each overridden method implementation. Unpleasant, to say the least.
To address this issue, the CDT provides a StepIntoSelection operation.
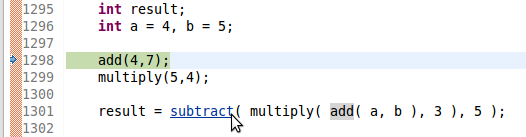
result = subtract( multiply( add( a, b ), 3 ), 5 ); // line 20
In the Editor simply set your cursor on the subtract() method and select Step into Selection from the Editor context menu or the main Run menu. Voila! with this single operation, the debugger will arrive directly into the subtract() method.
For quicker access the shortcut Ctrl+F5 can be used. Or, to really make things efficient, use hyperlink navigation by simply placing the cursor over the method and using Ctrl+Alt+Click to immediately step into it (note that by default Ctrl+Click will navigate to the source code, but can be overloaded to also perform a StepIntoSelection operation).
As shown above, StepIntoSelection can even be used on a method that is on a different line than the one under execution.
For those who also develop in Java, fear not, the JDT also provides this feature (in fact, the CDT StepIntoSelection was inspired by the one provided by the JDT).
Enhanced Expressions or The Power of the Expressions View
For years, the Expressions view has been a nice complement to the Variables view and Registers view, allowing users to control what information is of interest to them. It allows to specify specific variables and registers to be displayed, as well as combinations of them, by having the user explicitly define these expressions manually.
With the release of CDT 8.2, the Expressions view now accepts Enhanced Expressions. An Enhanced Expression is a way of easily writing an expression pattern that will automatically expand to a larger subset of children expressions. Four types of enhanced expressions can be used:
- Pattern-matched local variables
- Pattern-matched registers
- Pattern-matched array elements
- Expression groups
In the next sections, we explain how this support brings the Expressions view to a new level of usability, and even makes it possible for the Expressions view to optionally replace the use of the Variables and Registers views.
Pattern-matching syntax
A pattern-matching syntax based on Glob pattern-matching is used to specify enhanced expressions. The symbols * ? [ ] are used to create patterns with the expected meaning:
| * | Match any number of any character | ||||||||
| ? | Match exactly one of any character | ||||||||
| [ ] | Define a class of
characters. For example:
|
To indicate that pattern-matching should be performed the user must prefix enhanced expressions with the equal (=) symbol. This is important because the symbols used for pattern matching also have a meaning in C/C++. For example:
| my*var | means variable my multiplied with variable var |
| =my*var | means all variables starting with the letters my and ending with the letters var, with any number of characters in between |
Pattern-matched local variables
The first type of enhanced expression allows the user to specify a pattern that will automatically be matched to any existing local variable. The resulting set of children expressions will be sorted alphabetically. For example:
| =v?r | Will show all local variables starting with the letter v and ending with the letter r with a single character in between |
| =*x | Will show all local variables ending with the letter x |
Of particular interest is the pattern =* or *, which can be used to have the Expressions view behave like the Variables view while also providing sorting:
| =* | Will show all local variables of the selected stack frame sorted alphabetically |
| * | Same as =* since no confusion is possible in this case |
Pattern-matched registers
As for local variables, the user can specify a pattern that will automatically be matched to any existing register. The resulting set of children will be sorted alphabetically. Notice the $ prefix to indicate matching to registers (this was already the syntax for simple register expressions in the Expressions view). For example:
| =$e?x | Will show all registers starting with the letter e and ending with the letter x with a single character in between |
| =$*x | Will show all registers ending with the letter x |
| =$st[3-5] | Will show registers $st3, $st4, $st5 |
Of particular interest is the pattern =$* or $*, which can be used to have the Expressions view behave like the Registers view while also providing sorting:
| =$* | Will show all registers sorted alphabetically |
| $* | Same as =$* since no confusion is possible in this case |
Pattern-matched array elements
Another way to use enhanced expressions is to pattern-match array elements. For example:
| =myarray[30-40] | Will show elements of myarray from 30 to 40 inclusive |
| =myarray[1-5,20,30-32] | Will show elements of myarray from 1 to 5, as well as element 20, and elements 30 to 32 |
| =myarray?[1-5] | Will show elements from 1 to 5 of any array starting with the text myarray followed by a single character |
As can be seen in the last example, pattern-matching can be used on both the name of the array as well as its elements.
The keen observer will notice that the [] characters are not being treated as special characters in the examples above. The CDT has intelligent logic that determines when an enhanced expression is dealing with an array, in which case the [] characters are understood to be array index delimiters, instead of pattern-matching symbols.
Expression groups
Expression groups are two or more enhanced expressions separated by semi-colons (and optional spaces). For example:
| var1; var2 | Will have two children: variables var1 and var2 |
| =$eax;var1;$rsp | Will have three children: register $eax, variable var1, and register $rsp |
| var1; =$e* | Will have one or more children: variable var1 as well as any and all registers starting with the letter e |
Note that the order specified in the expression group definition is respected by the generated subset. This means that the user has control over where variables and registers will appear in the list of children of the expression group.
This feature allows to quickly define multiple expressions that interest the user. Because groups are created from these special expressions, they can be collapsed when uninteresting and re-expanded later, without having to be re-entered by the user.
The power of the Expressions view
Let’s have a quick look at a few of the many ways the Expressions view can be used, when we factor in Enhanced Expressions.
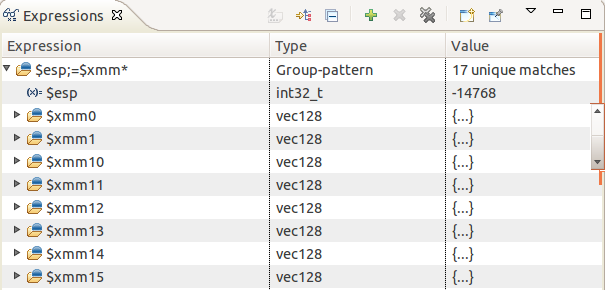
For users that deal with a large number of registers, it is easy to define enhanced expressions to list only registers of interest. For example, in a list of over one hundred registers, a user can focus on the xmm registers, as well as the stack pointer by defining the expression group: $esp;=$xmm*
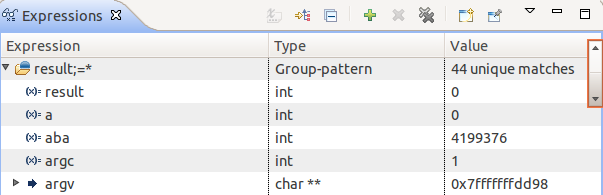
For users that rely heavily on the Variables view but long for a greater control of the display ordering, enhanced expressions can be used to automatically sort variables alphabetically, and even provide fine-grain control over ordering. For example, a user can choose to show all variables in alphabetical order while keeping variable result at the very top, by using: result;=*
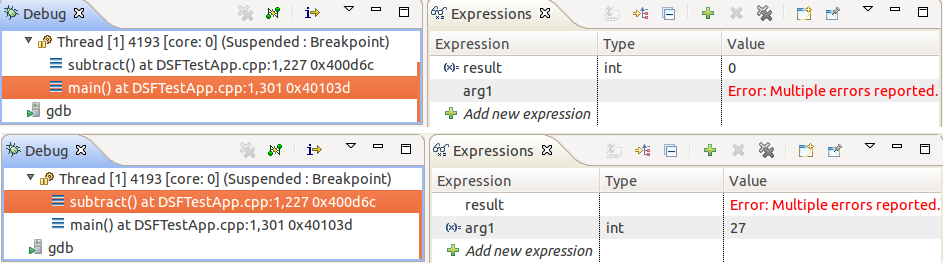
One of the issues in the traditional use of the Expressions view is that defined expressions may not always be applicable to the currently selected stack frame. The consequence is that some expressions cannot be evaluated and errors keep being shown to the user. In the example below, the variable result only exists in stack frame main() while arg1 only exists in subtract(), therefore, when the user selects different stack frames, errors always appear:
Using expression groups, we can avoid this problem by simply creating a group for each stack frame. In our example those groups can simply be: =result and =arg1 (prefixing each variable with the = sign triggers pattern-matching, in this case with a very specific pattern: the actual variable name).
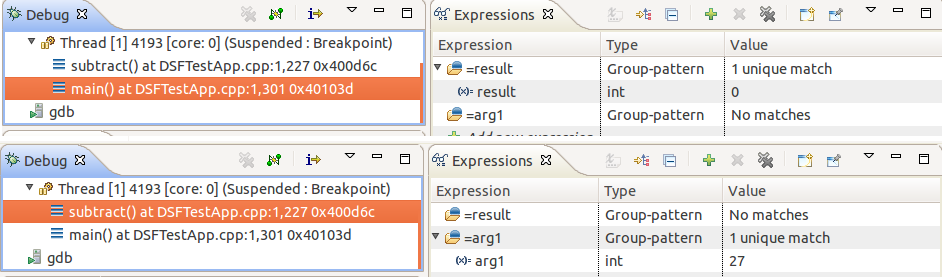
As shown above, no errors are reported anymore. Furthermore, thanks to the fact that the Expressions view remembers the expansion state of elements, as selected by the user, our defined groups will automatically collapse or expand, based on the selected stack frame; not only is this convenient to avoid showing errors, but it completely avoids the evaluation of the expression that is not applicable to the stack frame. This solution can also easily apply when dealing with variables and registers of different processes or cores.
To conclude, let’s take the time to mention that with the Cloning
feature of the debugging views, it is easy to open multiple
Expressions views and scroll each of them to have each one display
different expressions of interest, all at the same time (just use
the clone icon of the view  ).
).
(Multicore) Debug Workgroup
Much effort is being put around improving the CDT’s Debugging capabilities. Different features are being added and a variety of discussions and proposals are being put forth. To help coordinate this joint effort the (Multicore) Debug Workgroup was started, and currently counts over 10 regularly participating companies. Anyone interested in helping in this effort is welcome to join the monthly conference-call where we discuss progress, issues, features, tasks, etc. More information can be found at: http://wiki.eclipse.org/CDT/MultiCoreDebugWorkingGroup
Conclusion
The CDT community is active and motivated. We are always looking for new contributions and look to the future with excitement. The Debug component evolves at a quick pace, and although we would like to, we cannot describe here the many other interesting Multicore Debugging features already available in the CDT. To find out more, why not look into existing features that may spark your interest:
- Non-Stop debugging
- Pinning & Cloning of debugging views
- Displaying of cores in the debug view
- Multi-process debugging
- Multi-selection for Resume/Suspend operations
- Displaying only suspended threads
- OS resources view
- Breakpoint filtering
or get familiar with some of our upcoming features:
- Global Breakpoints based on a GDB proposal
- Showing return values of functions
- Synchronized operations
- Standalone debugger
- Process/Threads/Cores sets as proposed for GDB
About the Authors
