EclEmma – Java Code Coverage for Eclipse
Introduction
Test Driven Development (TDD) is a practice followed by most modern software projects nowadays. With this technique you always create automated regression tests along with your code. If you follow the Test First approach you even create your test cases before your actual code to help specifying clean APIs and come-up with minimal concise implementations.
Test suites are typically based on unit test frameworks like JUnit or TestNG and should be executed frequently during development - at least once before every checking-in. Fortunately, the Eclipse IDE supports this with integrated test runners.
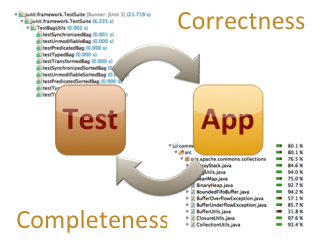
While the existing tests verify the correctness of the code under test there is no guarantee that the entire code base is actually tested. Especially legacy code bases often come with no or limited test coverage. This is where so-called code coverage tools come into picture: Such tools determine the portions of the code that has actually been executed by a test suite. Conversely code coverage tools help you to identify the untested parts of your code.
While your test suites verify the correctness of your code, code coverage measures the completeness of your test suites.
The Eclipse Plug-In
The EclEmma code coverage plug-in was created in 2006 and open-sourced under the Eclipse Public License (EPL). It was quickly adopted by the Eclipse Java developer community and got nominated for the Eclipse Community Award in 2007 (Finalist) and in 2008 (Winner). EclEmma retrieves code coverage metrics as conveniently as you execute your test suites directly in the IDE . The plugin can be easily installed from its update site at http://update.eclemma.org/ on any Eclipse installation of version 3.5 or above. It is also available from the Eclipse Marketplace.
After you have installed the plugin, you can run your tests using the new Coverage As launch configuration. This will display the code coverage in a convenient tree view as well as directly in your code.

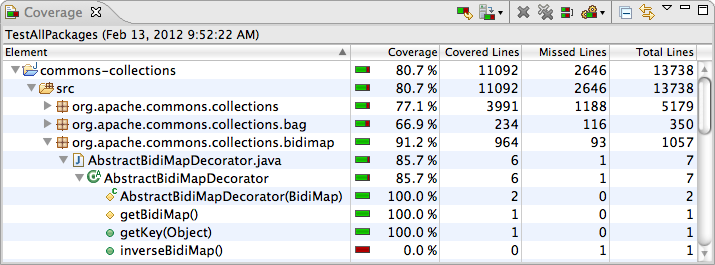
For any Java application executed in coverage mode, EclEmma collects coverage data and automatically calculates coverage statistics in the Coverage view as soon as the application terminates. This view shows different coverage metrics (instructions, branches, cyclomatic complexity, lines, methods, classes) and allows drilling-down from project to method level.
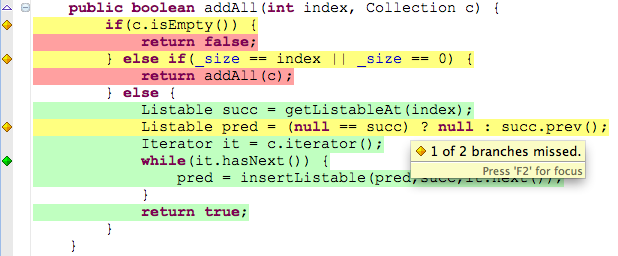
In addition, EclEmma highlights the execution status directly in the Java source editors: Green lines were fully executed, yellow lines were executed partially only and red lines were not hit at all. Little diamonds symbols in the editor's ruler, on the left to the source code, show the execution status of branches in your code (e.g.. for if and switch statements):
More Interesting Features
Aside from the most common use-cases, EclEmma has more features that are not so widely known. Depending on your test setup EclEmma can collect code coverage data from a running Java process without terminating it. For this the Coverage view provides a Dump Execution Data toolbar button. You can even retrieve execution data from a remote process that has a JaCoCo agent configured (see next section about the technology behind EclEmma) via the Coverage Session Import.
If you run multiple tests on the same code base in different launches (e.g. unit tests and integration tests) another toolbar button in the coverage view called Merge Sessions allows combining these executions in a single coverage analysis.
Once you collected some coverage data within you Eclipse IDE you might want to export the data in different formats. For this the Coverage Export Wizard creates, for example, browsable HTML reports with highlighted source code.
To find out more, the EclEmma user guide (which is also included with the plug-in's help pages) is a good starting point to get an overview over all features of this useful Eclipse plug-in.
Technology behind EclEmma
The EclEmma plug-in originally was designed as a wrapper for the EMMA code coverage library to make EMMA available within the Eclipse IDE. Since EMMA maintenance has stopped many years ago and missed functional enhancements, such as branch coverage or support for the latest JDKs, a completely new code coverage backend called JaCoCo was launched under the EclEmma project umbrella. Since the release of version 2.0 in 2012, EclEmma is - despite its name - backed by the JaCoCo code coverage library.
The JaCoCo library nicely complements the EclEmma Eclipse plug-in as there are extensive integrations with build tools like Ant, Maven, Gradle or SBT and also Continuous Inspection (CI) platforms like SonarQube.
Conclusion
As Uncle Bob Martin coined it: "Untested code is the dark matter of the software - apparently because it makes up 90% of the software universe". So let's start fighting dark matter by visualizing it with code coverage tools in your IDE and CI builds.
About the Authors